Tag Archives: etf

Following Slashing ETF Prices, State Street To Shutdown Three ETFs

MarketMuse update profiles the the second oldest financial institution in the United States, State Street’s plans to shut down three ETFs after what has been a very difficult year for them. The shutdowns are due to what they call “limited market demand”. With more of an update, an excerpt from InvestmentNews’ Trevor Hunnicutt’s story, “State Street to close three ETFs that attracted little investor interest” from 10 March , is below. 

The announced closure of the ETFs, including one municipal-bond fund in partnership with Nuveen Investments Inc., comes five weeks after the ETF pioneer slashed prices on nearly a third of its funds and while the firm faces outflows in its flagship fund.

State Street, who manages the first-to-market “SPDR” ETFs, will shut its S&P Mortgage Finance ETF (KME), S&P Small Cap Emerging Asia Pacific ETF (GMFS) and SPDR Nuveen S&P VRDO Municipal Bond ETF (VRD), according to a statement Monday. The funds are each at least three years old, but none hold more than $6 million in assets.

State Street, whose money managing arm is also known as SSGA, has $441 billion in U.S. ETF assets, third behind BlackRock Inc.’s iShares and the Vanguard Group Inc. The firm is perhaps best known for its SPDR S&P 500 ETF (SPY), which is commonly recognized as the first ETF traded in the U.S. as well as the most widely traded. That fund has lost $26 billion to investor redemptions this year, according to Morningstar Inc. estimates. State Street, whose index-tracking fund is used widely by tactical traders and institutions along with advisers, has said those flows are cyclical.

Meanwhile, the firm also has tried to expand its lineup to more profitable mutual funds and partnerships on ETFs with Nuveen and DoubleLine Capital’s Jeffrey Gundlach to attract assets into other product lines.

For the entire article from InvestmentNews, click here.

Trading Titan Point72 Gets to the Point: Big Data

MarketMuse update courtesy of Bloomberg Business profiles investment firm, Point72 Asset Management, expands its jobs to hire more employees in order to collect and analyze data. 

Steven Cohen’s investment firm is looking for an edge in public data.

Point72 Asset Management, the successor to Cohen’s hedge fund SAC Capital Advisors, has hired about 30 employees since the start of last year to build computer models that collect publicly available data and analyze it for patterns, according to two people with knowledge of the matter.

The hires are part of a project to expand quantitative investing, dubbed Aperio, that’s spearheaded by President Doug Haynes, said Mark Herr, a spokesman for the Stamford, Connecticut-based firm. Point72 is in the process of hiring a manager to oversee the strategy, he said, declining to comment on the number of professionals the firm has brought in so far.

Cohen, whose SAC Capital shut down last year and paid a record fine to settle charges of insider trading, joins Ray Dalio’s Bridgewater Associates in pushing into computer-driven investing, an area dominated by a handful of big firms such as the $25 billion Renaissance Technologies and the $24 billion Two Sigma. The money managers are seeking to take advantage of advances in computing power and data availability to analyze large amounts of information.

“Data used to come to you in a trickle and today it comes in torrents,” Herr said. “The amount of publicly accessible data can now be compared to a fire hose of information. People who can read the signals most accurately and analyze them are the ones who will generate returns.”

For the entire article, click here.

BlackRock Slashes Investing Cost Creating ETF War

MarketMuse update profiles BlackRock’s huge slash in investing cuts to cause pressure on rival is courtesy of Reuters’ Simon Jessop 10 March story “1-British ETF price war heats up with BlackRock FTSE 100 fee cut”

BlackRock, the world’s largest asset manager, has slashed the cost of investing in Britain’s oldest FTSE 100 exchange-traded fund, ratcheting up the pressure on rival providers such as Vanguard.

Demand for exchange-traded funds (ETFs) has surged in recent years as a result of often anaemic returns from more actively managed funds.

BlackRock said on Tuesday that it would now charge 7 pence a year per 100 pounds invested in its ETF that pays out dividend income, down from 40 pence previously, to make it the cheapest such tracker on the market. Both Vanguard and Deutsche Bank charge 9 pence, it said.

“It really doesn’t leave much more room to fall, but I don’t think the price war has ended,” said Adam Laird, head of ETFs at fund supermarket Hargreaves Lansdown. “In the U.S., you can get mainstream ETFs with fees as low as 0.03 percent.”

However, he said he expected rival providers to wait and see if clients switched their money before responding.

The iShares FTSE 100 UCITS ETF (Dist) fund was the first ETF to launch on the London Stock Exchange in 2000 and currently holds 3.8 billion pounds ($5.7 billion) of assets under management.

To read the entire story on how BlackRock is starting a war with its competitors from Reuters, click here.

Global Macro Strategy: Get Short-y

MarketsMuse global macro strategy insight courtesy of extract from today’s a.m. edition of Rareview Macro LLC’s “Sight Beyond Sight”, which includes references to the following ETFs: EMB, HYG and LQD.. For those already subscribing to “SBS”, you already know that this market strategist incorporates a cross-asset model portfolio that has outperformed a significant number of those who oversee billions of dollars on behalf of the world’s most demanding investors.

Neil Azous, Rareview Macro

New Tactical Trade – Short German DAX…Model Portfolio -33% Net Short Equities

US Dollar Input – Not Just “Patient” and “QECB” but also Balance Sheet Management

Credit – Watch EMB, HYG, LQD Today

Model Portfolio Update – March 6, 2015 COB:  +1.04% WTD, +0.89% MTD, 0.00% YTD

This morning, in the model portfolio we sold short the German DAX. Specifically, we sold 200 GXH5 (DAX Mar15) at 11485. This is a short term directional trade. The notional equates to 20% of the NAV. The update was sent in real-time via Twitter.

All in, between the S&P 500 and DAX, the model portfolio is approximately-33% net short equities. To put it in simple terms, there is an opportunity right now to short the market. Why? Because, either the FOMC Committee blinks, and you get paid until they do, or they do not blink and you get paid as risk assets discount further interest rate normalization. Either way, your short position will make you money.

Here is the best way to describe our sentiment at the moment: Continue reading

Apple’s Latest Move Could Hurt Investors

MarketMuse blog update courtesy of InvestmentNews. With the anticipation of tech giant, Apple’s launch event today and last week’s announcement of  Apple joining the DOW, there is a lot to be excited about. However, InvestmentNews’ Jeff Benjamin points out how it could hurt investors. 

Investors and advisers who own shares of Apple Inc. (AAPL) cheered the news that it will soon be in the granddaddy of all stock indexes. But in all the hoopla, they may miss the fact that their portfolios could become overexposed to the tech giant.

On March 19, Apple is slated to replace AT&T Inc. (T) in the 119-year-old Dow Jones Industrial Average. The news sent Apple shares up $1.05, or 0.83%, to $127.46, in afternoon trading Friday as the Dow tumbled 1.44%.

As investible indexes go, the Dow is far from the most popular, but $12.5 billion of assets are invested in the SPDR Dow Jones Industrial Average ETF. And DIA soon will include the tech giant, joining the S&P 500 and a plethora of mutual funds and exchange-traded funds that already own it.

Apple, which started paying a dividend three years ago, is a Top 10 holding in a dozen dividend-focused ETFs that include Vanguard High Dividend Yield (VYM) and Wisdom Tree Total Dividend (DTD), as well as the Russell 1000 Index through iShares Russell 1000 (IWB) and iShares Russell 1000 Growth (IWF).

“There are probably some people who own the S&P and the Dow, and now they will own Apple in both indexes,” Mr. Rosenbluth said. “But, obviously, Apple is not the only stock held in multiple indexes.”

For the entire article from InvestmentNews, click here. 

Cancer Treatment ETF Surges In Past Few Days

MarketMuse update courtesy of extract from Todd Shriber’s latest piece at ETFTrends. 

ETFTrends-logoShares of Pharmacyclics (NasdaqGS: PCYC), a maker of cancer treatments, surged nearly 17% Wednesday, extending a run that has seen the stock surge 80.1% this year, on news that the California-based company is mulling a sale.

Citing unidentified sources, Bloombergreports that Dow component Johnson & Johnson (NYSE: JNJ)and Swiss pharma giant Novartis (NYSE: NVS) could be among the suitors for Pharmacyclics. Multiple suitors for the company could prove to be a boon for the First Trust NYSE Arca Biotechnology Index Fund (NYSEArca: FBT), one of a scant number of exchange traded funds that have decent exposure toPharmacyclics.

Shares of FBT climbed 1.9% Wednesday on volume that was more than 25% above the three-month trailing average thanks in part to the ETF’s nearly 4.1% weight to Pharmacyclics. The stock was FBT’s third-largest holding as of Feb. 24, helping the ETF join 24 other healthcare funds among the 195 ETFs that hit all-time highs yesterday.

Where things get interesting for Pharmacyclics, and as a result, FBT, is how much of a premium a suitor will pay. Pharmacyclics closed Wednesday with a market value of $16.6 billion. Sources told Bloomberg the company could fetch $17 billion to $18 billion. The Financial Times reported Pharmacyclics could command $19 billion.

For the entire article from ETFtrends.com, please click here

China ETFs Seeming More Like The Year Of The Bear

MarketMuse update courtesy of ETFTrends’ Todd Shriber looking at China related ETFs. 

In the Chinese zodiac, 2015 is the year of the goat, but a popular exchange traded fund tracking China’s onshore equities is getting bearish treatment.

The Deutsche X-trackers Harvest CSI 300 China A-Shares ETF (NYSEArca: ASHR), the largest U.S-listed A-shares ETF, had 6.3% of its shares outstanding sold short as of Feb. 23, reports Belinda Cao forBloomberg.

ASHR surged 51.3% last year, making it one of 2014’s best-performing non-leveraged ETFs. That performance was better than quadruple the showing by the iShares China Large-Cap ETF (NYSEArca: FXI), the largest U.S.-listed China ETF. However, the 2014 A-shares rally has those stocks looking richly valued relative to their Hong Kong-listed counterparts, encouraging traders to up bearish bets on ASHR.

“The number of shares borrowed and sold short to profit from a decline in Deutsche Bank’s A-share ETF was 1.8 million on Feb. 23. That’s close to the record of 2.4 million, or 8.2 percent of total shares outstanding, reached Feb. 13,” Bloomberg reports, citing Markit data.

However, another catalyst could be encouraging the increased bearish bets on ASHR. On Jan. 21, Deutsche Asset & Wealth Management (DAWM) was forced to limit creations of new shares in ASHR because increased demand for the ETF was forcing the fund o bump up against their respective Renminbi Qualified Foreign Institutional Investor (RQFII), which allows the funds to purchase A-shares equities

Creation limits often lead to ETFs, particularly those with exposure to markets that are closed during the U.S. trading day, trading at premiums to net asset value. Professional traders then look to profit from the gap between the ETF’s market price and lower NAV by shorting the ETF. Since the start of 2015, ASHR has traded at a premium to its NAV in 26 days, according to DAWM data.

Although the most recently announced creation limit for ASHR has not yet been lifted, it should be noted the ETF was affected by the same scenario twice in 2014 and DAWM was quick to get ASHR’s RQFII limit increased.

With ASHR’s 2014 surge, some money managers now prefer H-shares to A-shares, but that means they are also missing out on a notable rally in A-shares small-caps.

The Deutsche X-trackers Harvest CSI 500 China A-Shares Small Cap Fund (NYSEArca: ASHS), which was subject to a second creation limit last November, is up 12.1% this year. ASHS tracks the CSI 500 Index of Shanghai- and Shenzhen-listed small-caps.

The Market Vectors ChinaAMC SME-ChiNext ETF (NYSEArca: CNXT), the younger of the two A-shares small-cap ETFs, has surged 23.7% year-to-date, making it 2015’s top-performing non-leveraged ETF. CNXT, which is heavily allocated to mid-caps, tracks the SME-ChiNext 100 (SZ399611), which provides exposure to the 100 most liquid mid- and small-cap stocks that trade on the Small and Medium Enterprise (SME) Board and the ChiNext Board of the Shenzhen Stock Exchange (SZSE).


J.P. Morgan War On Hacking Boosts ETF $ HACK

MarketMuse update courtesy of Yahoo Finance from ETF Trends. 

Earlier in the week, MarketMuse profiled cyber security ETFs recent boost and today, Brokerdealer.com profiled how J.P. Morgan’s war on cyber security is costing bankers’ jobs, so it only seemed fitting that MarketMuse combine to two subjects for today’s MarketMuse post. Since the threat of cyber security doesn’t seem to be going away anytime soon, J.P. Morgan is spending more money on cyber security protection and less money investors’ salaries resulting in the lowest banker hiring rate in recent years and growing cyber security ETFs.   

In what has become an almost daily affair in recent weeks, the PureFunds ISE Cyber Security ETF (HACK) is hitting record highs again Thursday and doing so on strong volume.

HACK, the first exchange traded fund dedicated to the cyber security industry, is up 1% today on volume that is already 36% above the daily average. As has been the case with HACK over its brief trading history (the ETF debuted in November), the catalysts for Thursday upside are easy to identify.

Namely, a Bloomberg article detailing J.P. Morgan Chase’s (JPM) commitment to bolstering its cyber security through increased spending and hiring of former military members. The bank was victimized by a cyber security breach in June 2014.

Given HACK’s penchant for responding favorably to such news items (see the controversy surrounding “The Interview” and the ETF’s reaction to the recent Anthem Blue Cross hack), it is not a stretch to say that if HACK was around in June, it would have soared in the days following news of the J.P. Morgan hack. [Anthem Hack Lifts Cyber Security ETF]

HACK did not exist in June 2014, but J.P. Morgan is having a favorable impact on the ETF. In October 2014, J.P. Morgan Chase (JPM) CEO Jamie Dimon said the banking giant will likely double its cyber security spending to $500 million within the next five years.

Important to HACK, Dimon is making good on that promise. J.P. Morgan’s security operation has 1,000 staffers, double the size of the comparable unit at Google (GOOG), according to Bloomberg. Add to that, J.P. Morgan is far from the only major financial services that is expected to increase cyber security spending in the coming years.

Citigroup’s (NYSE: C) cyber security budget jumped to $300 million at the end of last year while Wells Fargo (WFC) spends roughly $250 million a year on cybersecurity and has increased staffing in the area by 50%, according to the Wall Street Journal.

Increased cyber security spending by financial services firms is seen as a boon for companies such as FireEye (FEYE), Palo Alto Networks (PANW) and Japan’s Trend Micro. All three are members of HACK’s portfolio with FIreEye and Palo Alto Networks combining for 9.7% of the ETF’s weight.

Earlier this week, HACK surged after Russia’s Kaspersky Lab, a major cyber security firm, said a group of hackers have stolen as much as $1 billion from over 100 banks in 30 countries since late 2013.

Investors are buying into the thesis that increased cyber security spending bodes well for HACK’s longer-term potential. The ETF that the fund is now home to $231 million in assets under management, confirming HACK’s place on the list of most successful ETFs to debut in 2014. Impressively, HACK’s ascent to $231 million in AUM means the ETF has more than doubled in size over the past six weeks after topping $100 million in assets in early January. The ETF debuted in November.

For the original article, click here.

Should You Have An All-ETF Portfolio? Betterment CEO Has An Answer

MarketMuse update is courtesy of CNBC. CEO and Founder of Betterment , Jon Stein, offered his commentary on this issue to CNBC. Betterment is an automated investing service that provides optimized investment returns for individual, IRA, Roth IRA & rollover 401(k) accounts.

There’s a natural progression in the way the public responds to innovation. Something that first seems like a mere novelty becomes an interesting new niche, then a great idea and then, “How did we ever get along without this?”

In financial services, exchange-traded funds are somewhere around the third or fourth stage, between new niche and great idea. ETFs attracted more net investment last year ($239 billion) than did mutual funds ($225 billion), according to data from Morningstar. Five years earlier the net inflow into mutual funds was more than triple the net amount invested in ETFs.

In the last five years, the public’s affinity for ETFs raised assets under ETF management by 152 percent, to $2 trillion, up from $793 billion. Mutual fund assets only rose 53 percent during the same period.

Faster and cheaper information system infrastructure has helped the growth of ETFs. In my view, ETF portfolios will be the inevitable default for investors in the years to come because they are lower cost, more transparent and offer greater liquidity and tax advantages than mutual funds. Already, the increasing number of assets invested with automated investing services, which use all-ETF portfolios, underscores this shift.

Lower cost

By passively and systematically tracking an index, ETFs are far cheaper to run than most actively managed mutual funds that employ portfolio managers and analysts to select securities. That research costs money, and so does the frequent trading that’s common in such funds—they call it “active management” for a reason—not to mention the buying and selling of fund shares themselves, transactions that always involve the fund provider.

More transparent

ETFs also feature greater transparency. Their underlying portfolios change more rarely because the indexes that they’re based on generally maintain stable lists of components. The high turnover of many mutual funds and the fact that their holdings are reported only four times a year can make it difficult for shareholders to know exactly what they’re holding.

It’s not just the specific securities that can keep mutual fund investors in the dark. The broad nature of the fund itself can become obscured by what’s called “style drift.” Say growth is outperforming value; the managers of value funds, consciously or not, may start tilting toward more growth-oriented stocks.

Depending on what else they own, shareholders may become overweight in growth stocks and not even know it. By contrast, a value-stock ETF will hold value stocks no matter what.

ETFs are more transparent in another sense. The very low expenses and commoditized nature of ETFs make commissions and “kickbacks” to brokers or retirement-plan sponsors impractical. So if an ETF is recommended by an advisor or made available by a broker or retirement-plan sponsor, it’s likely to be an unbiased recommendation.

For the complete article from CNBC, click here

Take A Drag Or Sip Out Of These Industries: Smoke and Alcohol ETFs Are Hot

MarketMuse update is courtesy of Bloomberg’s Justin Fox. It is very difficult to invest stocks for long term, humans’ interests are always changing and that affects the stock market. Bloomberg’s Justin Fox suggests that people should invest in human behaviors such as the tobacco and alcohol industries, such as the tobacco sector big name, Philip Morris International Inc., PM or popular alcohol ETF,  Constellation Brands Inc., STZ. He explains that unless these products are banned, humans will always have an interest.

It would be really cool to know which industries are going to thrive and grow and create jobs in the future. It’s also really hard to figure that out ahead of time. If you’re just interested in which industries will deliver the best stock-market returns, though, history seems to point to an easy shortcut — invest in companies that sell addictive stuff.

I learned this dubious lesson by reading, in quick succession, two big new reports: the Brookings Institution’s analysis of the 50 “Advanced Industries” that are supposed to drive job and income growth in the U.S., and Credit Suisse’s annual “Global Investment Returns Yearbook.” The Brookings report tries to look into the future by measuring investment in technological progress by industry — and although most of the 50 advanced industries it identifies are what you would expect, there are some surprises. In the 2015 Credit Suisse yearbook, meanwhile, Elroy Dimson, Paul Marsh and Mike Staunton of London Business School examine 115 years of stock-market returns by industry, and while they document a lot of technological upheaval, the two biggest winners for investors turn out to be decidedly low tech.

An advanced industry, by Brookings’ accounting, is one “in which R&D spending per worker reaches the top 20 percent of all industries and the share of workers with significant STEM knowledge exceeds the national average.” (STEM = science, technology, engineering and math. And R&D = research and development. But you probably knew that.) There’s lots of research showing that technological change drives economic growth, and R&D spending and STEM knowledge are supposed to be proxies for future technological change.

I don’t know of any obviously better proxies, but the results show the difficulty of any such accounting. The list of the very biggest R&D spenders isn’t particularly surprising:-1x-1

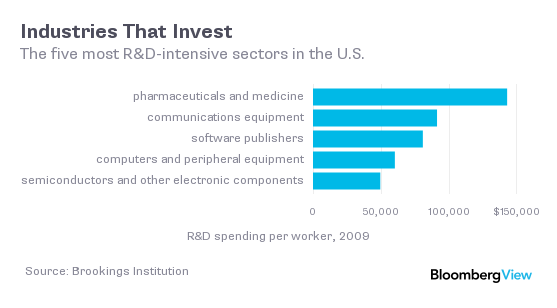
Dig deeper into the advanced industries list, though, and you soon come across industries that don’t seem all that advanced: railroad rolling stock, foundries, petroleum and coal products, metal-ore mining. Are these secret hotbeds of technological change that should command more attention? Probably not. One old-school industry, motor-vehicle manufacturing, does spend a ton on R&D ($48,461 per worker), but those others made the list mainly because there just aren’t that many industries in the U.S. that invest in R&D at all. To get to 50, you have to include a bunch of industries with per-worker spending of less than $5,000 a year. (No. 50, in case you’re wondering, is wireless-telecommunication carriers — which spent just $455 per worker in 2009.)

This isn’t necessarily a problem for the U.S. economy. One thing you’ll notice if you spend any time with the North American Industry Classification System is that it’s backward-looking. Older parts of the economy are divided into lots and lots of industries; newer ones aren’t. So you get railroad rolling-stock manufacturing, which employed 25,200 people in 2013 and generated $3.6 billion in output, counted as an industry on the same level as computer-systems design, which employed 1.7 million people and generated $246 billion.

Yet it’s these newer industries that generate the growth — at least, they have over the past 115 years. In 1900, according to the Credit Suisse yearbook, railroads accounted for 63 percent of stock-market value in the U.S. Now they’re less than 1 percent, and 62 percent of U.S. stock-market value is in industries that were small or nonexistent in 1900. The largest industries by market cap now are technology, oil and gas, banking and health care.

We’re all supposed to believe that past performance is no guarantee of future results. But given human nature, it seems reasonable to expect tobacco and alcohol to continue to do well — unless tobacco is completely banned, of course. Picking the next hot industry is a much harder task, yet it is a much more important one.

For the entire article, click here.


Threat Of Hackers Grows And So Does Cyber Security ETFs

MarketMuse update courtesy of Todd Shriber of ETF Trends, profiles the increase in cyber security ETFs as the threats of being hacked become more and more relevant.

The PureFunds ISE Cyber Security ETF (NYSEArca: HACKcontinues to cement its status as a legitimate event-driven exchange traded fund.

HACK is higher by 0.7% Tuesday on volume that is already more than quadruple the daily average after Russia’s Kaspersky Lab, a major cyber security firm, said a group of hackers have stolen as much as $1 billion from over 100 banks in 30 countries since late 2013.

Various media outlets are reporting those hackers are more interested in financial gain than pilfering personal information from the banks’ customers. That point is unlikely to assuage the banks or their customers, but it is enough to have HACK trading at record highs for the second consecutive session.

HACK’s Tuesday momentum is carrying over from last Friday when the ETF soared to a record high on volume of nearly 1.4 million shares as President Obama hosted the first-ever cyber security summit, which featured luminaries from throughout the tech industry, including Apple (NasdaqGS: AAPL) CEO Tim Cook.

Importantly, most of the action in HACK last Friday was of the bullish variety. So intense was buying activity in the ETF that the fund is now home to $231 million in assets under management, confirming HACK’s place on the list of most successful ETFs to debut in 2014. Impressively, HACK’s ascent to $231 million in AUM means the ETF has more than doubled in size over the past six weeks after topping $100 million in assets in early January. The ETF debuted in November.

News of the $1 billion bank hack, while positive for HACK in the near-term, also serves as reminder of the long-term opportunity with the ETF because the financial services industry is expected to be one of the largest spenders on cyber security enhancements in the coming years.

In October 2014, J.P. Morgan Chase (NYSE: JPM) CEO Jamie Dimon said the banking giant will likely double its cyber security spending to $500 million within the next five years.

HACK benchmarks to the ISE Cyber Security Index, “which tracks the performance of companies actively engaged in providing services for cyber security and for which cyber security business activities are a key driver of their business model. These cyber security services are designed to protect computer hardware, software, networks and data from unauthorized access, vulnerabilities, attacks and other security breaches,” according to PureFunds.


German ETFs Offer Good Opportunities in Rebounding European Market

MarketMuse update is courtesy of ETF Trends’ Todd Shriber.

Earlier this week and over the past few months, MarketMuse has been covering the rocky European market, thanks to Greece, and its recent rebound, with ETF $GVAL. Now investors have even more to be excited about with the recent success of German ETFs. 

The U.S. is not the only developed market where stocks are eying record highs. Germany’s benchmark DAX accomplished that feat Friday, climbing above 11,000 for the first time.

Exchange traded fund investors are responding, pumping massive of amounts of capital into Germany ETFs. The Recon Capital DAX Germany ETF (NasdaqGM:DAX), the only U.S.-listed DAX-tracking ETF, is up nearly 8% in the past month.

With its heavy tilt toward large, multi-national companies, the DAX index is benefiting from a depreciating euro currency. A weaker euro would help support export growth and potentially generate greater revenue from overseas operations for the multi-nationals.

A weak euro and sturdy data out of the Eurozone’s largest economy is prompting investors to put new capital to work with Germany ETFs. Through Thursday, only three ETFs have seen greater inflows than the $494.1 million added to the iShares MSCI Germany ETF (NYSEArca: EWG), the largest Germany ETF.

One of those three is the WisdomTree Europe Hedged Equity Fund (NYSEArca:HEDJ), which allocates 26% of its weight to German stocks. No ETF has seen larger 2015 inflows than HEDJ’s $4.1 billion in new assets and the gap between HEDJ and the second-place inflows ETF, the SPDR Gold Shares (NYSEArca: GLD), is sizable at over $1.6 billion.

Thanks to the faltering euro, investors are also flocking to currency hedged Germany ETFs. After taking in $450 million on Thursday, the iShares Currency Hedged MSCI Germany ETF (NYSEArca: HEWG) has added over $491 million this week. The ETF, which uses EWG with a EUR/USD hedge, had $287.4 million in assets heading into Thursday.

On a percentage basis, the Deutsche X-trackers MSCI Germany Hedged Equity Fund (NYSEArca: DBGR) and the WisdomTree Germany Hedged Equity Fund (NasdaqGM: DXGE) have also seen significant asset growth. DXGE has more than doubled in size this year while DBGR has tripled in size since the start of 2014.

Underscoring the advantage of the euro hedge with German equities, DBGR and DXGE have both produced double-digit returns over the past month while EWG is up “just” 7.5%. Importantly, economic data supports the case for more upside for Germany ETFs,

“German gross domestic product expanded 0.7 percent in the fourth quarter, soaring past an estimate for 0.3 percent. Private consumption rose markedly in the fourth quarter, and investment developed positively, driven by a significant increase in construction output,” reports Inyoung Hwang for Bloomberg.


Take A Bite Out of This Apple: Tech ETF Surges Off Of Apple’s Success

MarketMuse update is courtesy of ETF Trends’ Tom Lydon

Shares of Apple (NasdaqGS: AAPL) are up a modest by the stock’s standards 0.6% today, pushing the iPhone maker’s market capitalization to a lofty $732 billion and some change.

As has been well-documented, Apple’s ascent to becoming the first company with a market value of $700 billion and its targeting of the unheard of $1 trillion stratosphere is benefiting plenty of exchange traded funds. One of those ETFs is the Fidelity MSCI Information Technology Index ETF (NYSEArca: FTEC).

FTEC is one of the newer kids on the sector ETF block, having debuted in October 2013 as part of Fidelity’s 10-ETF sector suite. That group has since grown by one with the recent addition of theFidelity MSCI Real Estate Index ETF (NYSEArca: FREL).

Fidelity has navigated the ultra-competitive sector ETF landscape with success. In June 2014, Fidelity’s original 10 sector ETFs had a combined $1 billion in assets under management, a number that has since more than doubled to $2.2 billion.

FTEC has been a primary driver of Fidelity’s sector ETF growth. At the end of January, the ETF had $352.6 million in assets under management, good for the second-best total among Fidelity sector ETFs behind the Fidelity MSCI Health Care Index ETF (NYSEArca: FHLC).

In an environment where Apple has more than restored its juggernaut status, FTEC earns its place in the Apple ETF conversation with a weight of 17.1% to the iPad maker. That is more than double FTEC’s weight to Microsoft (NasdaqGS: MSFT), its second-largest holding.

FTEC’s Apple weight of 17.1% also exceeds the weight to that stock found in one of the fund’s primary rivals, the Vanguard Information Technology ETF (NYSEArca: VGT).Unlike rival ETF issuers, Vanguard does not update its funds’ holdings on a daily basis, opting to do so once a month. VGT’s latest holdings update, from Dec. 31, 2014, showsan Apple weight of 15.3%. With the stock’s 14.5% gain this year, VGT’s Apple exposure is now likely well over 16%.

FTEC and VGT compete for the affections of cost-conscious investors as both charge just 0.12% per year, making the pair the least expensive tech sector ETFs on the market. Each has returned 2.1% year-to-date.

Like its rivals, FTEC is a cap-weighted ETF, meaning as Apple’s market value rises, the stock’s presence in FTEC grows. Since the start of December, FTEC’s Apple weight has increased by 140 basis points.

“FTEC offers more exposure to semiconductors and data processing & outsourced services companies and no exposure to integrated telecom services stocks,” according to S&P Capital IQ, which rates the ETF overweight.

Catch Europe’s Rebound With $GVAL ETF

MarketMuse update profiling Europe’s market rebounding is courtesy of ETF Trends’ Tom Lydon

With Greece seemingly in the headlines every day, and rarely with good news, it is easy for investors to perceive European equities as damaged and vulnerable to more declines.

On the brighter side of the ledger, history is littered with examples that highlight the profitability of contrarian investing and buying when others are fearful. Enter the Cambria Global Value ETF (NYSEArca: GVAL).

GVAL debuted in March to 2014 and to say the ETF was the victim of inauspicious timing is to understate matters. While an ideal way to gain access to some attractively valued developed European markets, GVAL also features ample emerging markets exposure. Neither emerging nor non-U.S. developed markets were the places to be soon after GVAL debuted.

“GVAL has gotten off to a humble start. But if you’re a believer in value investing as a discipline, then GVAL deserves a serious look. In a market in which the U.S. has outpaced its foreign competitors for years, I consider GVAL to be an excellent, diversified rebound play on Europe and emerging markets,” according to Charles Sizemore.

GVAL’s current emerging markets exposure among its top 10 country weights does not lack for controversy. Brazilian stocks, embroiled in a graft controversy surrounding Petrobras (NYSE: PBR), made up 12% of GVAL’s weight at the end of the fourth quarter. Russia and Greece, rarely deliverers of good news, combined for another 14% of GVAL at the end of 2014, according to Cambria data.

“But herein lies the beauty of GVAL. Few investors would have thick enough skin to take a large position in any of these countries individually. But even investors with nerves of steel would have trouble building a viable portfolio of stocks from most of these markets due to the lack of available U.S.-traded ADRs to buy.   Very few investors have access to the small and mid-cap foreign stocks that dominate GVAL’s portfolio,” notes Sizemore.

The actively managed GVAL targets the cheapest, most liquid picks in countries where political or economic crisis have depressed valuations. GVAL’s eligible country universe includes Greece, Russia, Hungary, Ireland, Spain, Czech Republic, Italy and Portugal. At the end of 2014, 56% of the ETF’s country weight was allocated to Eurozone nations.

Investors can also access a sliver of GVAL via the Cambria Global Asset Allocation ETF (NYSEArca: GAA). Known as the ETF without an annual fee, GAA debuted in December and holds other ETFs. At the time of launched, GAA held a 4% weight to GVAL.

Greece ETF Crumbles to Ruins

MarketMuse update is courtesy of Business Insider’s Sam Ro

MarketMuse has previously reported on the volatility the Greece elections created early this year now even more problems have ensued for the country. Following the the European Central Bank’s announcement that it lifted its waiver on minimum credit rating requirements for marketable instruments issued or guaranteed by Greece, Greece’s ETF crashed leaving just ruins left.

The Greek stock market closed hours ago, but the exchange-traded fund that tracks Greek stocks, GREK, crashed during the final minutes of trading in the US markets.

The euro is also getting walloped, falling 1.3% against the US dollar.

This comes following bad news from the European Central Bank (ECB) to Greece’s debt-laden banks.

Shortly after 3:30 p.m. ET, the ECB announced that it lifted its waiver on minimum credit rating requirements for marketable instruments issued or guaranteed by Greece.

To put it another way, Greek banks can no longer exchange their junk-rated sovereign bonds for cash.

“The waiver allowed these instruments to be used in Eurosystem monetary policy operations despite the fact that they did not fulfill minimum credit rating requirements,” the ECB said in a press release. “The Governing Council decision is based on the fact that it is currently not possible to assume a successful conclusion of the programme review and is in line with existing Eurosystem rules.”

“In other words, the ECB doesn’t see Greece complying with existing bailout rules,” Bloomberg’s Lorcan Roche Kelly explained.

However, it’s not all bad. The ECB has another way for Greek banks to exchange their securities for liquidity. The cost of borrowing will however be higher.

“Liquidity needs of Eurosystem counterparties, for counterparties that do not have sufficient alternative collateral, can be satisfied by the relevant national central bank, by means of emergency liquidity assistance (ELA) within the existing Eurosystem rules,” the ECB said.

“The move from the ECB today is a copy of the suspension of Greek debt that occurred in February 2012,” Kelly noted.

“For Greek banks, this move by the ECB will not directly be a disaster as they have reduced their exposure to the Greek sovereign since 2012 and so are less reliant on that debt as collateral,” Kelly argued.

Still, it appears to be more bad than good. And judging by the reaction in the currency and equity markets, investors and traders were hoping for better.

For the original article, click here.

Mutual Funds Issuer Hoping to Enter the ETF Ring

MarketMuse update courtesy of ETF Trends’ Tom Lydon

American Funds, one of the largest mutual funds issuer, are waiting for the SEC to approve an application for the issuer to enter the ETF industry. 

Capital Group Cos., the parent company of American Funds, submitted an application for ETFs to the SEC a year ago. A notice from the SEC indicates approval of American Funds’ ETF foray appears likely though there is still time for opponents to request an SEC hearing, though such a hearing is unlikely, reports Trevor Hunnicutt for InvestmentNews.

California-based American Funds has $1.2 trillion in assets under management, or more than half the current AUM tally for the U.S. ETF industry. However, ETFs are the fastest-growing corner of the asset management industry, underscoring the desire of mutual fund companies to become involved with products that institutional investors and advisors are increasingly adopting.

While it took nearly two decades for the ETF industry to reach $2 trillion in assets, it will not need nearly as long to get to $5 trillion, according to a new report by PwC. The PwC repots says the global ETF industry will reach $5 trillion in combined AUM by 2020.

News of American Funds potentially entering the ETF business represents a reversal from the company’s previous stance on ETFs. The company has been a strident supporter of active management at a time when data indicate many active managers consistently fail to beat their benchmarks.

In September 2013, Capital Group published a study that “argued that its stock-picking mutual funds outperformed their benchmark indexes in the majority of almost 30,000 periods examined over the past 80 years. That included 57 percent of one-year stretches, 67 percent of 5-year periods and 83 percent of 20-year ranges. The Capital Group study examined 17 of the company’s mutual funds that invest in equities or both equities and bonds. It measured their performance over every one-, three-, five-, 10-, 20- and 30-year period, on a rolling monthly basis, from Dec. 31, 1933, through Dec. 31, 2012.”

Still, “only about 13% of actively managed, large-company stock funds posted returns above that of the S&P 500 for 2014,” the Wall Street Journal reports.

Although the SEC notice did not specify whether American Funds will issue active or passive ETFs, the firm’s reputation for active management implies the company would favor actively managed ETFs, a still small, but fast-growing segment of the ETF business. Some industry observers also see actively managed ETFs being a key driver of ETF industry growth in the coming years. For the week ending Jan. 16, U.S.-listed actively managed ETFs had a combined $17.24 billion in AUM with nearly half that total allocated to PIMCO and First Trust ETFs, according to AdvisorShares data.

While that is just a fraction of the overall U.S. ETF industry, increased demand for active ETFs and the potential for a more favorable regulatory environment could make actively managed ETFs a $500 billion asset class by 2020, according to a report by publishedSEI Investments last year.


Russia’s ETF Tries to Get Back On The Horse

MarketMuse update courtesy of ETF Trends’ Todd Shriber.

MarketMuse has been profiling the recent market turmoil found all across Europe but mainly Greece and Russia. After a difficult past six months, Russia’s ETF has recently been back on the rise. 

Entering Tuesday, the Market Vectors Russia ETF (NYSEArca: RSX) sported a six-month loss of 35.2%, making it difficult to be bullish on Russian equities.

However, what is now a three-day rally for oil futures is compelling some traders to revisit RSX and the adventurous are even mulling positions in the Direxion Daily Russia Bull 3x Shares (NYSE: RUSL), the triple-leveraged equivalent to RSX. RSX is the oldest, largest and most heavily traded Russia listed in the U.S.

Over the past five days, the United States Brent Oil Fund (NYSEArca: BNO) is up more than 14%, which is important because Russia, the largest non-OPEC producer in the world, prices its oil in Brent terms, the global benchmark. RSX and RUSL have responded with arguably tepid five-day gains of 1.6% and 4.3%, respectively.

Still, traders with temerity might want to give RUSL a look because there are signs of capitulation among RSX bears.

“The RSX, country ETF for Russia, seen below on the daily timeframe, shows a consolidation pattern which has morphed into a sideway channel. Bears have thus far failed to crack it lower, perhaps blinded by love for a crash in crude and failing to recognize the temporary bottoming signs in place for energy and energy stocks. Thus, RUSL is on my radar as a levered long play, especially if RSX holds over $15.30 today,” according to Chessnwine of Market Chess.

Russia ETF

Lunch with Russia ETFs, in particular RUSL, is far from free. RSX has a three-year standard deviation of 27.2%. Said another way, RSX has been 1,200 basis points more volatile than the MSCI Emerging Markets Index over the past three years.

Additionally, oil prices will likely determine the near-term fate of RSX and RUSL. After all, no non-OPEC is as heavily dependent on oil as a driver of government revenue as Russia is. Nearly half of Russia’s government receipts come by way of oil exports.

Of course, there is the valuation argument, a familiar refrain of Russia bulls in recent years. Indeed, Russian stocks are down right cheap. At a forward P/E of four, the MSCI Russia Index trades at less than half valuation of the MSCI Emerging Markets Index and about a quarter of the valuation of the S&P 500.

There is another interesting point in favor of RUSL: Investors’ tendency to be wrong with leveraged ETFs. RUSL has seen outflows of over $21 million over the past month,according to Direxion data.

There is validity in going against the crowd with leveraged ETFs. Consider this: From about Aug. 20, 2014 to Sept. 23, the Direxion Daily Gold Miners Bear 3X Shares (NYSEArca: DUST) lost $185.3 million in assets but surged 55% over that period.

Guggenheim Investments Eyes Currency Hedged ETFs

MarketMuse update is courtesy of Reuters

Guggenheim Investments, the seventh-largest ETF issuer in the United States, is considering trying on currency hedged ETFs for size.

Guggenheim Investments is considering launching one or more currency hedged exchange-traded funds, one of the hottest and most sought-after financial products the last few months.

“I will confirm that we’re interested in this space,” Bill Belden, Guggenheim’s managing director of product development in Chicago told Reuters on Friday. “We’re very familiar with the currency space and we’re always interested in providing new products whether they’re hedged or not.”

A currency-hedged ETF removes the foreign currency return of a given fund by buying a forward contract in the currency, and rolling it typically on a monthly basis.

Currency-hedged ETF assets grew 48 percent in 2014 to roughly $20.8 billion, and have grown 1,519 percent over the past two years, according to Deutsche Bank AG, a major player in the space.

In contrast, unhedged European equity ETFs have seen six straight months of outflows since June 2014, with an aggregate $8.9 billion in outflows, Deutsche Bank data shows. On the other hand, hedged European equity ETFs have seen consistent inflows over the same period, taking in $4.5 billion.

A strong dollar is prompting U.S. investors to buy hedged ETFs. Typically, currency-hedged ETFs protects the underlying international equity exposure against a falling foreign currency such as the euro or yen.

BlackRock Inc, WisdomTree Investments Inc and Deutsche Bank are the three major players in the currency-hedged ETF space. WisdomTree, which was the first to this ETF sector, is the largest of the three, with about 80 percent of the roughly $20 billion allocated to currency-hedged ETFs.

WisdomTree in January alone attracted $1.6 billion in inflows, according to Luciano Siracusano, WisdomTree’s chief investment strategist.

But Guggenheim’s Belden said there’s room for more players in the industry. Guggenheim has about $28.8 billion in ETF assets and roughly $220 billion overall.

“The hedged ETF you have seen basically captures an exposure to an international market that hedges against a local currency’s falling value,” said Belden.

“But we know that local currencies don’t fall perpetually. It has been a pretty consistent trend in the past but we don’t know what’s going to happen to those strategies, if any particular currency goes the other way.”

Guggenheim has a suite of nine currency ETFs, totaling about $1.1 billion. Of the nine ETFs, two have shown positive returns. CurrencyShares Japanese Yen Trust is up 1.5 percent so far this month, and the CurrencyShares Swiss Franc Trust is up 8 percent.