
Not to be confused with yet another social media ETF comprised of social media companies, the latest flavor in the creative world of exchange-traded funds is courtesy of ALPS Advisors and Sprott Asset Management; an ETF that tracks the performance of the BUZZ Social Media Insights Index, which in turn, identifies U.S. companies that rank highest in terms of ‘positive public perception’ as measured by ‘the buzz’ on social media platforms.
The ticker symbol at NYSEArca is $BUZ, and while our very own MarketsMuse senior editor suggested a better ticker symbol would be “BUZZ”, that ticker is rumored to have been reserved by former NYMEX Chairman Richard Shaeffer in connection with his backing of Americanex Corp, an upstart electronic exchange platform for cannabis growers and distributors, and run by former Tullett Prebon FX broker Steve Janjic.
Still don’t get the value proposition of buying an ETF comprised of companies that inspire positive social media generated vibes via their brands? Especially when a single snarkly tweet from a much-followed celeb or political candidate (e.g. Trump) can cause a company’s share price to plunge in a nanosecond? MarketsMuse curators canvassed an assortment marcom experts who also understand the nuances of investing and the senior resident at The JLC Group distilled the description of the ALPS ETF with this comment, “..the presumption presumably is that companies having a high rank insofar as perception (aka$BUZALPS Advisorsamericanex corpBUZZ Social Media Insights Indexexchange-traded fundsNYMEX Chairman Richard ShaefferNYSEArca: BUZpositive buzzsocial media ETFSprott Asset ManagementSteve Janjictom lydon
While many are looking to move away from coal as a power source, such as China, the coal ETF, Market Vectors-Coal ETF (NYSEArca: KOL) and recently launched coal ETF, GreenHaven Coal Fund (NYSEArca:TONS), have to continued to demonstrate that trend as their fires dim down to a mere dust. This MarketsMuse update profiles the dim outlook two above listed coal ETFs are facing as countries explore other sources of power. This update is courtesy of ETFTrends’ Tom Lydon and his article, “Coal ETF Outlook Growing Dim” with an excerpt. Some bargain hunters may be looking at the downtrodden coal industry and related exchange traded funds as the market remains near historic lows. However, coal remains depressed for a reason. Over the past three months, the Market Vectors-Coal ETF (NYSEArca: KOL), which tracks the coal industry, has declined 6.9%. Additionally, the recently launched GreenHaven Coal Fund (NYSEArca:TONS), which is designed to offer investors with exposure to daily changes in the price of coal futures contracts, has decreased 3.6%. Some may be tempted to catch the falling knife as the economy still depends on coal to meet growing electricity needs. However, the other fundamental factors may weigh on the space. To continue reading about these coal ETFs bleak outlook, click here MarketsMuse blog update profiles asset manager Nuveen Investments quietly returning to the world of ETFs. This MarketsMuse blog update is courtesy of ETFTrends Tom Lydon’s article, “Nuveen Tiptoes Back Into ETFs“, with an excerpt below. After departing the exchange traded funds business in 2002, Nuveen Investments has returned in quiet fashion. The Chicago-based firm said Monday shareholders of the Nuveen Long/Short Commodity Total Return Fund (NYSEArca: CTF), have approved the plan to convert the fund into open-ended exchange-traded fund (ETF). The conversion plan is also contingent on customary regulatory approvals, according to a statement. “The Annual Meeting of Shareholders for the Nuveen Diversified Commodity Fund (NYSE: CFD) has been adjourned to June 15, 2015, to allow additional solicitation of votes on the proposed plan to convert the fund into an ETF,” according to Nuveen. Nuveen said in December it was planning to convert CTF and CFD into ETFs. CFD invests in an array of commodity futures and forward contracts. As of the end of November, the mutual fund allocated a combined 26.5% of its weight to oil and gold,according to issuer data. The fund’s annual expenses total 1.75%. To continue reading about Nuveen’s quiet return, click here. MarketsMuse blog update profiles Goldman Sachs preparing for a launch of its own ETFs. Goldman Sachs is the largest U.S. investment bank and they are finally going to make the move to become a huge player in the ETF industry. The firm has completed all its necessary paperwork with the SEC as of May 4th for its six ETFs. These six new ETFs include: Goldman Sachs ActiveBeta International Equity ETF (GSIE), Goldman Sachs ActiveBeta Emerging Markets Equity ETF (GEM), Goldman Sachs ActiveBeta Europe Equity ETF (GSEU), Goldman Sachs ActiveBeta Japan Equity ETF (GSJY), Goldman Sachs ActiveBeta U.S. Large Cap Equity ETF (GSLC) and the Goldman Sachs ActiveBeta U.S. Small Cap Equity ETF (GSSC). This MarketsMuse blog update is courtesy of ETFTrends’ Tom Lydon and his article, “Goldman ETFs Near Liftoff“, with an excerpt below. Goldman Sachs (NYSE: GS), the largest U.S. investment bank, is getting closer to launching its own exchange traded funds. In a filing with the Securities and Exchange Commission dated May 4, New York-based Goldman Sachs revealed tickers and fund managers for its six “ActiveBeta” ETFs as well as tickers for its five passively managed ETFs. Among Goldman the managers for the ActiveBeta ETFs are “Steve Jeneste, a managing director most recently oversaw portfolio management of macro and multi-asset strategies. Another is Raj Garigipati, vice president, who most recently served as chief risk officer for Goldman’s QIS unit,” reports Chris Dieterich for Barron’s. To continue reading about Goldman Sachs preparing for the launch of its six “ActiveBeta” ETFs, click here. MarketsMuse blog update profiles solar ETFs such as Guggenheim Solar ETF (NYSEARCA:TAN) and Market Vectors Solar Energy ETF (NYSEARCA:KWT) bright future thanks to China’s clean energy drive. This update is courtesy of Seeking Alpha’s article, “China’s Clean Energy Drive Brightens Solar Power ETFs” by ETFTrends reporter, Tom Lydon, with an extract below. China revealed a huge surge in photovoltaic panel installations over the first quarter, a typically slow season for the industry, and if the country maintains its pace, it could portend a strong year for solar stocks and sector-related exchange traded funds. Year-to-date, the Guggenheim Solar ETF (NYSEARCA:TAN) jumped 40.8% and the Market Vectors Solar Energy ETF (NYSEARCA:KWT) increased 30.3%. On Monday, the China National Energy Administration announced that the country added 5.04 gigawatts of solar capacity, or just shy of France’s entire solar capacity, in the first three months of the year, Bloomberg reported. China is planning to install as much as 17.8 gigawatts of solar power this year, or two-and-a-half times the capacity added by the U.S. in 2014, as part of its aggressive plans to cut carbon emissions. For instance, the country’s recent move away from small coal plants will avoid the annual release of as much as 11.4 million metric tonnes of carbon dioxide, which could help cut emissions for the first time in over a decade, Today Online reports. Chinese companies make up 22.9% of TAN’s underlying holdings and a hefty 38.4% of KWT’s portfolio. To continue reading about the effects that China’s push for clean energy has on the solar ETFs, click here. MarketsMuse blog update profiles the record breaking year ETFs have had. As investors become more comfortable with the idea of using ETFs as an investment strategy, ETFs continue to become more and more popular. ETFs’ assets have grown at an exponential rate over last ten years. In fact, ten years ago ETF assets totaled $230 billion in the US and now we near the $3 trillion marker. This MarketsMuse update is courtesy of ETFTrends’ Tom Lydon’s article “ETF Industry Closing in on $3 Trillion” with an extract below. After attracting an additional $36.1 billion, global ETFs saw $97.2 billion in inflows over the first quarter, or almost triple the total for the same quarter year-over-year. [ETFs Haul in $36.1 Billion in March] As of the end of February, assets invested in exchange traded products, which include both ETFs and exchange traded notes, globally reached a new record high of $2.919 trillion. “The global ETF/ETP industry had 5,632 ETFs/ETPs, with 10,902 listings, from 245 providers listed on 63 exchanges in 51 countries,” according to ETFGI’s Deborah Fuhr. “We expect the assets to break through the US$3 trillion milestone in the first half of 2015.” To continue reading the article from ETFTrends, click here. They say you should always shoot for the moon and that is exactly what BATs exchange is doing. MarketMuse update profiles BATS exchange looks to hit it out of Nasdaq’s and the New York Stock Exchange’s parks. The ETF-only exchange out of Kansas City, BATS, is planning on becoming the number one ETF trading venue by 2020 which means passing both the Nasdaq and the NYSE. BATS. This MarketMuse update is courtesy of Tom Lydon’s article “BATS Looks to be Dominant ETF Exchange” on ETFTrends.com. An excerpt from the article is below. “There was a total of 1,411 U.S.-domiciled ETFs at the end of 2014, according to the Investment Company Institute, with more than 1,000 listed by Intercontinental Exchange’s NYSE unit and the balance by Nasdaq OMX Group,” report John McCrank and Jessica Toonkel for Reuters. To read the entire article from ETFTrends, click here MarketsMuse update inspired by yesterday’s column by Tom Lydon/ETFtrends.com and smacks at the heart of what certain “bomb throwers” believe could be a Black Swan event, albeit an event that may not be driven by a global crisis or surprise economic event. The event in question will, in theory, take place when interest rates start ticking up (and underlying corporate bond prices tick down) and institutional bond fund managers find themselves trying to figure out whether to simply suffer from mark-downs (and performance) or to continue collecting coupons until the issues they hold mature. MM Editor Note: Since most folks know that bond managers are akin to lemmings (no disrespect intended!) and typically follow each other like blind mice, given the massive size of the corporate market place, a potential avalanche could take place when everyone runs for the exit if rates tick up and simultaneously, the economy starts to slow. Wall Street dealers are certainly not going to be available to catch those falling knives, simply because new regulations have put a crimp in the capital they can commit to warehousing positions. Worse still, its easy to envision one very long contango event, where the cash ETF trades at a discount to the value of the underlying bonds, simply because one won’t be able to sell those underlying bonds in any type of material size. Here’s an opening extract from Tom Lydon’s piece “Liquidity Concerns In Corporate Bond ETFs”: Continue reading MarketMuse update is courtesy of Tom Lydon from ETF Trends. Continuing with what has turned out to be exhausting coverage of European ETFs, the Portuguese, Irish, Italian, Spanish and Greek stocks (the PIIGS) ETFs are showing a bright immediate future for the Eurozone. Though still controversial, due in part to looming speculation that Greece could potentially depart the Eurozone, exchange traded funds tracking Portuguese, Irish, Italian, Spanish and Greek stocks (the PIIGS) have the look of value propositions. Even with Greece’s change in government, one that threatens the country’s ability to pay its debts, meet funding needs and could hasten the country’s Eurozone departure, the Global X FTSE Greece 20 ETF (NYSEArca:GREK) has mustered a small year-to-date gain. Earlier this month, Standard & Poor’s pared its rating on Greece’s sovereign debt to B- from B. The ratings agency is keeping the long- and short-term ratings on Greece on CreditWatch with negative implications. Greece’s B- rating is just one notch above CCC, a rating that implies vulnerability to nonpayment “and is dependent upon favorable business, financial, and economic conditions for the obligor to meet its financial commitment on the obligation,” according to S&P, scenarios that Greece is unlikely to meet in the near-term. The iShares MSCI Italy Capped ETF (NYSEArca: EWI) and the iShares MSCI Ireland Capped ETF (NYSEArca: EIRL), often seen as the steadiest hand of the five PIIGS ETFs, have been far more alluring than GREK this year. EWI and EIRL are up an average of 6.5% with average volatility of about27%. GREK is up about 2% with 93% volatility. Investors looking for exposure to multiple PIIGS through the convenience of one ETF that emphasizes value investing can turn to the actively managed Cambria Global Value ETF (NYSEArca: GVAL). Cambria’s Mebane Faber “Faber employs a statistic called the Cyclically Adjusted Price-Earnings (CAPE) ratio to evaluate countries. First developed by Nobel Prize winner Robert Shiller, the CAPE has proven effective at predicting the future performance of U.S. stocks. The lower the ratio is, the higher the expected return. Faber has applied the CAPE to other countries in his own research. Examining a period from 1980 through 2013, he found that those countries’ markets with a CAPE below seven subsequently produced a 14.4% 10-year annualized return while those with the highest CAPE above 45 produced only 1.2%,” reports Lewis Braham for Barron’s. GVAL targets the cheapest, most liquid picks in countries where political or economic crisis have depressed valuations. GVAL’s eligible country universe includes Greece, Russia, Hungary, Ireland, Spain, Czech Republic, Italy and Portugal. At the end of 2014, the five PIIGS member nations combined for 46% of GVAL’s weight,according to Cambria data. Portugal’s CAPE is 7.7, Italy’s 9.6, Ireland and Spain about 11. The U.S.’s, by contrast, is 27, according to Barron’s. Helped by its PIIGS exposure and what was an 8% weight to suddenly resurgent Russian stocks at the end of last year, GVAL is up 6.4% over the past month, giving the ETF an advantage of 60 basis points over the iShares MSCI ACWI ex U.S. ETF (NasdaqGM: ACWX). For the original article from ETF Trends, click here MarketMuse update is courtesy of ETF Trends’ Tom Lydon. Shares of Apple (NasdaqGS: AAPL) are up a modest by the stock’s standards 0.6% today, pushing the iPhone maker’s market capitalization to a lofty $732 billion and some change. As has been well-documented, Apple’s ascent to becoming the first company with a market value of $700 billion and its targeting of the unheard of $1 trillion stratosphere is benefiting plenty of exchange traded funds. One of those ETFs is the Fidelity MSCI Information Technology Index ETF (NYSEArca: FTEC). FTEC is one of the newer kids on the sector ETF block, having debuted in October 2013 as part of Fidelity’s 10-ETF sector suite. That group has since grown by one with the recent addition of theFidelity MSCI Real Estate Index ETF (NYSEArca: FREL). Fidelity has navigated the ultra-competitive sector ETF landscape with success. In June 2014, Fidelity’s original 10 sector ETFs had a combined $1 billion in assets under management, a number that has since more than doubled to $2.2 billion. FTEC has been a primary driver of Fidelity’s sector ETF growth. At the end of January, the ETF had $352.6 million in assets under management, good for the second-best total among Fidelity sector ETFs behind the Fidelity MSCI Health Care Index ETF (NYSEArca: FHLC). In an environment where Apple has more than restored its juggernaut status, FTEC earns its place in the Apple ETF conversation with a weight of 17.1% to the iPad maker. That is more than double FTEC’s weight to Microsoft (NasdaqGS: MSFT), its second-largest holding. FTEC’s Apple weight of 17.1% also exceeds the weight to that stock found in one of the fund’s primary rivals, the Vanguard Information Technology ETF (NYSEArca: VGT).Unlike rival ETF issuers, Vanguard does not update its funds’ holdings on a daily basis, opting to do so once a month. VGT’s latest holdings update, from Dec. 31, 2014, showsan Apple weight of 15.3%. With the stock’s 14.5% gain this year, VGT’s Apple exposure is now likely well over 16%. FTEC and VGT compete for the affections of cost-conscious investors as both charge just 0.12% per year, making the pair the least expensive tech sector ETFs on the market. Each has returned 2.1% year-to-date. Like its rivals, FTEC is a cap-weighted ETF, meaning as Apple’s market value rises, the stock’s presence in FTEC grows. Since the start of December, FTEC’s Apple weight has increased by 140 basis points. “FTEC offers more exposure to semiconductors and data processing & outsourced services companies and no exposure to integrated telecom services stocks,” according to S&P Capital IQ, which rates the ETF overweight. MarketMuse update profiling Europe’s market rebounding is courtesy of ETF Trends’ Tom Lydon. With Greece seemingly in the headlines every day, and rarely with good news, it is easy for investors to perceive European equities as damaged and vulnerable to more declines. On the brighter side of the ledger, history is littered with examples that highlight the profitability of contrarian investing and buying when others are fearful. Enter the Cambria Global Value ETF (NYSEArca: GVAL). GVAL debuted in March to 2014 and to say the ETF was the victim of inauspicious timing is to understate matters. While an ideal way to gain access to some attractively valued developed European markets, GVAL also features ample emerging markets exposure. Neither emerging nor non-U.S. developed markets were the places to be soon after GVAL debuted. “GVAL has gotten off to a humble start. But if you’re a believer in value investing as a discipline, then GVAL deserves a serious look. In a market in which the U.S. has outpaced its foreign competitors for years, I consider GVAL to be an excellent, diversified rebound play on Europe and emerging markets,” according to Charles Sizemore. GVAL’s current emerging markets exposure among its top 10 country weights does not lack for controversy. Brazilian stocks, embroiled in a graft controversy surrounding Petrobras (NYSE: PBR), made up 12% of GVAL’s weight at the end of the fourth quarter. Russia and Greece, rarely deliverers of good news, combined for another 14% of GVAL at the end of 2014, according to Cambria data. “But herein lies the beauty of GVAL. Few investors would have thick enough skin to take a large position in any of these countries individually. But even investors with nerves of steel would have trouble building a viable portfolio of stocks from most of these markets due to the lack of available U.S.-traded ADRs to buy. Very few investors have access to the small and mid-cap foreign stocks that dominate GVAL’s portfolio,” notes Sizemore. The actively managed GVAL targets the cheapest, most liquid picks in countries where political or economic crisis have depressed valuations. GVAL’s eligible country universe includes Greece, Russia, Hungary, Ireland, Spain, Czech Republic, Italy and Portugal. At the end of 2014, 56% of the ETF’s country weight was allocated to Eurozone nations. Investors can also access a sliver of GVAL via the Cambria Global Asset Allocation ETF (NYSEArca: GAA). Known as the ETF without an annual fee, GAA debuted in December and holds other ETFs. At the time of launched, GAA held a 4% weight to GVAL. MarketMuse update courtesy of ETF Trends’ Tom Lydon American Funds, one of the largest mutual funds issuer, are waiting for the SEC to approve an application for the issuer to enter the ETF industry. Capital Group Cos., the parent company of American Funds, submitted an application for ETFs to the SEC a year ago. A notice from the SEC indicates approval of American Funds’ ETF foray appears likely though there is still time for opponents to request an SEC hearing, though such a hearing is unlikely, reports Trevor Hunnicutt for InvestmentNews. California-based American Funds has $1.2 trillion in assets under management, or more than half the current AUM tally for the U.S. ETF industry. However, ETFs are the fastest-growing corner of the asset management industry, underscoring the desire of mutual fund companies to become involved with products that institutional investors and advisors are increasingly adopting. While it took nearly two decades for the ETF industry to reach $2 trillion in assets, it will not need nearly as long to get to $5 trillion, according to a new report by PwC. The PwC repots says the global ETF industry will reach $5 trillion in combined AUM by 2020. News of American Funds potentially entering the ETF business represents a reversal from the company’s previous stance on ETFs. The company has been a strident supporter of active management at a time when data indicate many active managers consistently fail to beat their benchmarks. In September 2013, Capital Group published a study that “argued that its stock-picking mutual funds outperformed their benchmark indexes in the majority of almost 30,000 periods examined over the past 80 years. That included 57 percent of one-year stretches, 67 percent of 5-year periods and 83 percent of 20-year ranges. The Capital Group study examined 17 of the company’s mutual funds that invest in equities or both equities and bonds. It measured their performance over every one-, three-, five-, 10-, 20- and 30-year period, on a rolling monthly basis, from Dec. 31, 1933, through Dec. 31, 2012.” Still, “only about 13% of actively managed, large-company stock funds posted returns above that of the S&P 500 for 2014,” the Wall Street Journal reports. Although the SEC notice did not specify whether American Funds will issue active or passive ETFs, the firm’s reputation for active management implies the company would favor actively managed ETFs, a still small, but fast-growing segment of the ETF business. Some industry observers also see actively managed ETFs being a key driver of ETF industry growth in the coming years. For the week ending Jan. 16, U.S.-listed actively managed ETFs had a combined $17.24 billion in AUM with nearly half that total allocated to PIMCO and First Trust ETFs, according to AdvisorShares data. While that is just a fraction of the overall U.S. ETF industry, increased demand for active ETFs and the potential for a more favorable regulatory environment could make actively managed ETFs a $500 billion asset class by 2020, according to a report by publishedSEI Investments last year. MarketMuse update courtesy of ETF Trends, Tom Lydon. Tom Lydon highlights Recon Capital ETF that follows a covered call strategy successful first year. A little unknown exchange traded fund that follows a covered call strategy has generated robust dividend yields over its first year. The Recon Capital NASDAQ-100 Covered Call ETF (NasdaqGM: QYLD), which began trading on December 12, 2013, has provided a distribution yield of 10.4% in 2014, according to a press release. QYLD provides a covered-call strategy that targets Nasdaq-100 securities. Additionally, for those who rely on regular income payments, the ETF provides monthly distributions. The covered-call options strategy allows an investor to hold a long position in an asset while simultaneously writing, or selling, call options on the same asset. Traders would typically employ a covered-call strategy when they have a neutral view of the markets over the short-term and just bank on income generation from the option premium. In a flat market condition, the trader would use the buy-write strategy to generate a premium on the option. If shares fall, the option expires worthless and one still keeps the premiums on the options. However, the strategy can cap the upside of a potential rally – the trader keeps the premium generated but any gains beyond the strike price will not be realized. During last year’s rally, QYLD underperformed the broader market, rising 3.6% over the past year. Nevertheless, the ETF somewhat made up the difference through its robust income generation on option premiums. The monthly options premiums also provided a buffer from market volatility and helped hedge traditional investment allocations. The covered-call ETF strategy may act as a decent alternative investment strategy to a traditional equity and fixed-income portfolio, especially in the environment ahead. “Unlike many fixed income investments, QYLD faces no headwinds from rising interest rates, nor is it susceptible to duration risk,” Kevin R. Kelly, Managing Partner of Recon Capital, said in the press release. “Rather, QYLD seeks to provide investors with a low volatility, non-leveraged, tax-efficient product that pays out a monthly income, instead of making distributions by quarter or on an annual basis. We are proud to round out 2014 – and the first year of QYLD trading — with a 10.4 percent yield for our investors, particularly as the 30 Year Treasury sits below 2.75 percent.” MarketMuse update courtesy of ETF Trends’ Tom Lydon. The U.S. exchange traded products industry hit a major milestone last year, eclipsing $2 trillion in assets under management, but industry observers do not see that growth slowing. Rather, it is expected that ETFs will continue their exponential growth rate in the years ahead. While it took nearly two decades for the ETF industry to reach $2 trillion in assets, it will not need nearly as long to get to $5 trillion, according to a new report by PwC. The PwC repots says the global ETF industry will reach $5 trillion in combined AUM by 2020. “New types of indexing (also referred to as “smart beta”) represent a hotbed of product development activity with 46 percent of firms surveyed identifying this as the most important area of innovation. PwC expects this to continue for the near-term. Active ETFs (34 percent) and alternatives (29 percent) are also expected to be sources of significant ETF growth between now and 2020,” according to the “ETF 2020” report. The rise of strategic beta ETFs has also played a significant role in boosting U.S. ETF assets. As of late August, assets under managements across smart beta ETFs totaled $350 billion, a 30% year-over-year increase. Much of that growth has been driven by institutional investors, including large money managers, endowments and pensions. The growth of these non-traditional ETFs has been exponential as smart beta ETFs accounted for just 19% of total industry assets at the end of 2013. [U.S. ETFs top $2 Trillion in AUM] Some industry observers also see actively managed ETFs being a key driver of ETF industry growth in the coming years. For the week ending Jan. 16, U.S.-listed actively managed ETFs had a combined $17.24 billion in AUM with nearly half that total allocated to PIMCO and First Trust ETFs, according to AdvisorShares data. While that is just a fraction of the overall U.S. ETF industry, increased demand for active ETFs and the potential for a more favorable regulatory environment could make actively managed ETFs a $500 billion asset class by 2020, according to a report by publishedSEI Investments last year. [Big Growth Seen for Active ETFs] “In the U.S., institutional investors, including registered investment advisors, wealth management platforms, other asset managers, endowments and foundations are each expected to continue to expand their investments in ETFs between now and 2020,” said PwC. Those comments jibe with data released last year by several major ETF issuers that show institutional investors are increasingly turning to ETFs. Institutional investors continue to be key drivers of ETF asset growth, a theme that is expected to continue in 2015. In its 2014 U.S. Institutional ETF Usage Report, BlackRock (NYSE: BLK) notes the “results show that institutional use of ETFs is expected to rise across the board. This trend holds true for both existing institutional ETF investors and those who do not currently hold ETFs.” [Institutions Boost ETF Usage] Fixed income and global ETFs are expected to be favorites of institutional investors this year. That prediction has proven accurate to this point in 2015 as three international ETFs and one bond fund rank among the top 10 asset-gathering ETFs on a year-to-date basis. MarketMuse update courtesy of Tom Lydon from ETF Trends. This update acts as a follow up from one of yesterday’s posts. Thursday’s biggest financial market headlines came courtesy of the Swiss National Bank (SNB), which opted to drop the franc’s peg to the euro, a move that sent the Swiss currency soaring and Swiss stocks to one of their worst one-day performances on record. The CurrencyShares Swiss Franc Trust (NYSEArca: FXF) easily Thursday’s top performing non-leveraged ETF with a gain of over 17% on volume that was nearly 34 times trailing three-month daily average. SNB’s decision to do away with the franc’s euro peg was a surprise, particularly because it conflicted with recent rhetoric from the central bank, which indicated SNB was looking to defend the EUR/CHF peg. Forex traders and ETF investors alike were caught off-guard. “Data from the Commodity Futures Trading Commission released on Friday showed net short positions of 24,171 contracts on the Swiss franc, the largest since June 2013. Adding in 662 short option contracts gives a combined position of 24,833 contracts or $3.5 billion at the current rate of around 0.90 franc to the dollar,” according to Reuters. Regarding ETFs, the iShares MSCI Switzerland Capped ETF (NYSEArca: EWL), the largest U.S.-listed Switzerland ETF, lost almost $27 million in assets since the start of 2015 heading into Thursday while FXF was light by almost $5 million. The First Trust Switzerland AlphaDEX Fund (NYSEArca: FSZ), a smart beta spin on Switzerland ETFs, had not lost or taken in any money since the start of the new year. Those numbers are not staggering, but fourth-quarter outflows from Switzerland ETF paint a better picture of investors missing out on Thursday’s Swissie surge. In the last three months of 2014, investors pulled nearly $198 million from EWL and $113.5 million from FSZ. With gold prices languishing and the dollar surging, investors also did not stick around to wait for a franc rally and pulled almost $10 million from FXF. Of course it is with the benefit of hindsight and few if any traders could see a 17% one-day move coming for a currency ETF, but investors that left equity-based Switzerland ETFs missed out on EWL surging nearly 4% and FSZ climbing 3.7% Thursday. Some former gold ETF investors also missed. The SPDR Gold Shares (NYSEArca:GLD) lost $3.2 billion in assets last year and has bled another $115 million to start 2015, but a sustained rally by the franc could ameliorate that situation. On Thursday, GLD, the world’s largest gold ETF, climbed 2.5% on more than double the average daily volume to reclaim its 200-day moving average for the first time since September. For the original article from ETF Trends, click here. MarketMuse update courtesy of ETF Trends’ Tom Lydon. In 2014, just over 200 new exchange traded products launched in the U.S., more than double the nearly 90 that closed, but even with launches continuing to easily outpace closures, some major ETF issuers are getting choosy about the new number of rookie products they bring to market. For example, BlackRock (NYSE: BLK), the parent company of iShares, the world’s largest ETF sponsor, launched 29 new ETFs in 2014, a number that matches the ETFs shuttered by the firm, reports Victor Reklaitis for MarketWatch. The bulk of iShares’ closures came by way of an August announcement declaring 18 closures. Ten of those 18 ETFs, all of which ceased trading in mid-October, were target date funds. In early 2014, iShares announced the closure of 10 ex-U.S. sector ETFs. Some of the more successful ETFs launched by iShares last year include the $146.1 million iShares Core Dividend Growth ETF (NYSEArca: DGRO), the $206.2 millioniShares Core MSCI Europe ETF (NYSEArca: IEUR) and the $140.3 million iShares MSCI ACWI Low Carbon Target ETF (NYSEArca: CRBN). Increased selectivity by issuers when it comes bring new ETFs could become a more prominent theme as the battle for investors’ assets intensifies. Simply put, many new ETFs struggle out of the gates and go months if not years with nary a glance from advisors and investors. As of late December, 92 of the ETFs launched last year had over $10 million in assets under management and none of 2014’s crop of new ETFs came within spitting distance of the over $1 billion accumulated by the First Trust Dorsey Wright Focus 5 ETF (NasdaqGM: FV). FV debuted last March and by November had over $1 billion in assets There are more than 7,500 U.S. open-end mutual funds, MarketWatch reports, citing Morningstar data, implying there is room for the U.S. ETF industry to grow from the current area of about 1,700 products. One thing is clear: Different issuers are taking different approaches to new ETFs. For example, Vanguard, the third-largest U.S. ETF issuer, did not bring a new ETF to market in 2014 but still managed to add $75.3 billion in new ETF assets, a total surpassed only by iShares. Earlier this month, Pennsylvania-based Vanguard said it expects to launch its first municipal bond ETF early in the second quarter. First Trust, one of the fastest-growing U.S. ETF sponsors, launched 15 new products last year, including FV. For the original article from ETF Trends, click here. MarketMuse update courtesy of ETF Trends’ Tom Lydon’s 6 January story. Vanguard, the third-largest U.S. issuer of exchange traded funds, has filed plans with the Securities and Exchange Commission to introduce the firm’s municipal bond ETF. The Vanguard Tax-Exempt Bond Index Fund will be the firm’s first tax-exempt index fund and ETF. Pennsylvania-based Vanguard already has a substantial municipal bond footprint with about $140 billion in tax-exempt bond and money market funds, according to a statement issued by the firm. Vanguard offers 12 actively managed municipal bond funds (five national, seven state-specific) and six tax-exempt money market funds (one national, five state-specific), according to the statement. The Vanguard Tax-Exempt Bond Index Fund is expected to debut in the second quarter with three share classes – Investor Shares, Admiral Shares and ETF. The new ETF will have an annual expense ratio of 0.12%, well below the average annual fee of 0.49% on municipal bond ETFs, said Vanguard, citing Lipper data. The statement did not include a ticker for the new ETF. “For investors in high tax brackets, a high-quality, broadly diversified municipal bond fund or ETF can provide tax advantages as well as diversification from the risks of the equity market,” said Vanguard CEO Bill McNabb in the statement. “Vanguard is pleased to bring a low-cost index option to the municipal category as a complement to our lineup of low-cost actively managed tax-exempt bond funds.” That jibes with Vanguard’s reputation for being one of the low-cost leaders in the ETF space. In December, Vanguard lowered fees on 12 of its equity-based ETFs, including 10 sector funds, moving the issuer into a tie with Fidelity for the least expensive sector ETFs. Vanguard currently sponsors 13 fixed income ETFs, including the behemoth VanguardTotal Bond Market ETF (NYSEArca: BND). Home to nearly $24 billion in assets under management, BND was one of 2014’s top asset-gathering ETFs. Other Vanguard bond ETFs include the Vanguard Extended Duration Treasury ETF (NYSEArca: EDV) and the Vanguard Total International Bond ETF (NYSEArca: BNDX), two last year’s top performing bond funds. Last year, investors poured a record $215.5 billion into Vanguard funds, including $75.3 billion into Vanguard ETFs. Including BND, four Vanguard ETFs were among the top 10 asset-gathering ETFs in 2014. For the original story in ETF Trends, click here. MarktMuse update courtesy of extract from ETF Trends’ Tom Lydon. After natural gas futures dipped below $3 for the first time in two years, the commodity and related exchange traded funds are warming up on cold weather next week, but any gains may be brief as temperatures could remain above normal for the rest of the month. The United States Natural Gas Fund (NYSEArca: UNG) was up 1.4% Friday whileiPath Dow Jones-UBS Natural Gas Total Return Sub-Index ETN (NYSEArca: GAZ)was 1.0% higher. Over the past year, UNG declined 28.6% while GAZ fell 20.2%. NYMEX natural gas futures surged in early trading Friday but settled just shy of $3 per million British thermal units. Natural gas futures were heating up from a 27-month low on speculation that a cold snap could stoke demand for heating fuel next week. According to Commodity Weather Group, “a sizable chunk of arctic air” will cover the Midwest, South and East next week, reports Naureen S. Malik for Bloomberg. However, while temperatures will drop next week, the weather will likely warm up and continue to weigh on natural gas prices after next week. While the cold outbreak “is occurring on the anniversary of last year’s polar vortex big event, we do not expect it to reach those levels,” Matt Rogers, president of Commodity Weather, said in a note. “The other big story is the warmer pattern shift for the 11-15 day,” raising temperatures up to seasonal norms across most of the lower 48 states from January 12 to 16. Additionally, supply remains robust due to new hydraulic fracturing techniques in shale oil beds, further weighing on natural gas prices through the season. “We don’t look for this rally to carry above the $3 mark in today’s session despite some possible cold updates to the temperature views,” energy-advisory firm Ritterbusch & Associates said, the Wall Street Journal reports. “Production has been running at a near-record clip.” For Lydon’s full article on ETF Trends, click here.
Coal ETF’s Burns Dim
![]()

Nuveen Investments Has Returned To ETFs…Quietly
Goldman Sachs Readies ETF Launch
![]()

Solar ETFs Continue to Rise Thanks to China

ETFs Are Having A Record Breaking Year, Near $3 Trillion Mark
![]() Exchange traded funds are becoming a household name as investors have been piling into the investment vehicle, expanding the global ETF market toward $3 trillion in assets.
Exchange traded funds are becoming a household name as investors have been piling into the investment vehicle, expanding the global ETF market toward $3 trillion in assets.
An ETF-only Exchange? BATS at Bat
![]() Most exchange traded products in the U.S. trade on the New York Stock Exchange or the or the Nasdaq Global Market. That is not stopping Kansas City-based BATS Global Markets from the ambitious goal of being the largest U.S. ETF listing venue in three to five years.
Most exchange traded products in the U.S. trade on the New York Stock Exchange or the or the Nasdaq Global Market. That is not stopping Kansas City-based BATS Global Markets from the ambitious goal of being the largest U.S. ETF listing venue in three to five years.
Corporate Bond ETFs and Liquidity: A Looming Black Swan or Extended Contango?

PIIGS Bring Home the Bacon For The Eurozone

Take A Bite Out of This Apple: Tech ETF Surges Off Of Apple’s Success
Catch Europe’s Rebound With $GVAL ETF

Mutual Funds Issuer Hoping to Enter the ETF Ring
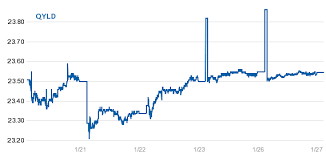
A Little Known ETF, Recon Capital, Comes Out Big in Its First Year
ETF Industry Growing At Rapid Rate; Assets Will Hit $5 Trillion By 2020

ETF Investors Have Regret Following the Swiss National Bank’s Announcement

Issuers Get Pickier Over Which ETFs to Launch
![]()
Vanguard Files For The Company’s First Muni Bond ETF
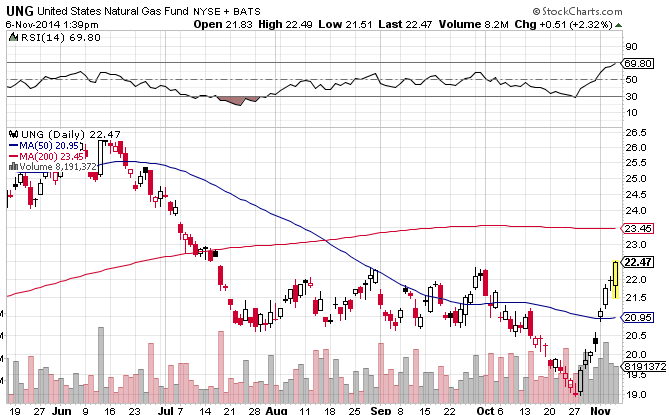
The US’s Deep Freeze Gives Temporary Boost to Natural Gas ETFs