Tag Archives: WisdomTree

Oh My! RIAs: Forbes Advisor Playbook iConference-Sep 17-CE and CFP Credits

For RIAs who want to be smarter (and at the same time, earn CFP and CE credits, MarketsMuse points you to the Sept 17, Forbes Advisor Playbook iConference. Why? Well for one, Shark Tank shark extraordinaire Kevin O’Reilly a newbie ETF Issuer of exchanged-traded funds firm “O’Shares”  (whose first product is OUSA) will be a guest speaker, along with a list of other industry luminaries that include Schorders’ Head of US Multi-Sector Fixed Income Andy Chorlton, Tim Palmer, Head of Global Interest Rates for Nuveen, Luciano Siracusano, Chief Investment Strategist for WisdomTree.

What does the day long session include? 6 timely topics ranging from Capital Markets and Game Theory to debating Optimal Active vs. Passive Portfolio Construction. MarketsMuse knows this will be a must-attend simply because the program is being coordinated by Julie Cooling of RIAchannel and our favorite ETF journalist, Todd Shriber aka ETF Godfather will be one of the program’s moderators.

What’s In It For You? 6 CFP and 6 CIMA CE Credits!

How do you sign up? Click Here!

ETF Land: Its All About the US Dollar

MarketsMuse ETF update profiles the most talked about topic: the US Dollar courtesy of extract below from March 25th coverage from Todd Shriber of ETFtrends.com. Here’s the snippet:

For over a year, exchange traded funds tracking the U.S. dollar have been the stars of the currency ETF group, but recent weakness in the greenback could prompt some investors to assess other currency opportunities.

Todd Shriber, ETFtrends.com

Since topping on March 13, the PowerShares DB U.S. Dollar Index Bullish Fund (NYSEArca: UUP), the U.S. Dollar Index tracking ETF, and the actively managed WisdomTree Bloomberg U.S. Dollar Bullish Fund (NYSEArca: USDU) are off 3.6% and 3%, respectively.

The much maligned CurrencyShares Euro Currency Trust (NYSEArca: FXE) is up nearly 4.7% over that period and recent dollar weakness has gold ETFs, such as the SPDR Gold Shares (NYSEArca: GLD), on six-day winning streaks. None of that means the dollar’s run is over. In fact, some market observers believe the recent pullback in the U.S. currency presents a buying opportunity. Continue reading

Currency-Hedged ETFs In Demand by Global Macro-Focused Traders

MarketsMuse update courtesy of reporting by Reuters’ Gertrude Chavez-Dreyfuss and Ashley Lau

NEW YORK (Reuters) – U.S. investors spooked by wild swings in the foreign exchange market are piling into exchange-traded funds that strip out the local currency on their international equity portfolios, making them one of the most sought-after financial products in 2015.

With the dollar having rallied more than 19 percent since the beginning of 2014, investors are seeing gains in overseas stock markets eaten up by losses against the greenback.

“People are voting with their feet,” said Luciano Siracusano, chief investment strategist for WisdomTree Investments in New York. “They’re putting billions of dollars into these funds, and what they’re saying is, ‘We don’t want to be 100 percent unhedged.’”

Some say there aren’t enough of these products for investors looking for international exposure. These ETFs have about $31.5 billion in assets, up nearly five-fold from 2011. But assets in international equity ETFs exceed $275 billion, according to WisdomTree.

“There are 40 countries with stock markets deep enough to have a currency-hedged product,” said David Kotok, chairman and chief investment officer of Cumberland Advisors in Sarasota, Florida, which oversees $2 billion, and whose firm’s equity investments are solely through ETFs. Continue reading

WisdomTree Case Study: ETF Best Execution

MarketsMuse editor note: The following post, extracted from Jan 6 submission to ETFtrends.com is best described as an advertorial courtesy of WisdomTree Investments, one of the ETF industry’s leading Issuers. While readers of MarketsMuse might be inclined to muse “[This ‘case study’ is] Elementary, my dear Watson, totally elementary!,” MarketsMuse editors would retort: “You would be astounded by the number of ‘sophisticated’ investment managers who somehow still don’t understand how block trades in ETFs are best executed, and precisely who these managers should be seeking objective guidance from before hitting a “send” button.

Equally important: the below submission makes frequent reference to ETF “market-makers”, a phrase that traditionally infers “proprietary trader who is taking the other side of a customer’s trade in order to extract a trading profit.” In today’s market structure, those who ‘make’ markets also include agency-only brokers, who, unlike traditional “market-makers”, agency brokers perform a similar role within the context of providing best available 2-sided quotes; they act as fiduciaries and specialize in sourcing liquidity from among an assortment of “market-makers. Instead of trading against customers, these brokers act in the interest of customers and simply charge a pre-disclosed commission for sourcing liquidity and executing  the right price. As such, these agency-only experts act in the interests of the customer and [arguably] are the best route for fiduciaries who seek best price based on an aggregation of all available bids and offers that are typically not displayed on ubiquitous, screen-based markets.

Here is the extract of WisdomTree’s submission:

wisdom treeThis blog post is relevant to institutional investors interested in trading exchange-traded funds (ETFs) in significant volume. Individual investors do not always have access to liquidity providers to trade ETFs as referenced below.

What if I told you that a large $500 million order and a smaller $1.2 million order traded in the same ETF, but one executed around the bid/ask spread and the other drove up the ETF price 84 cents, or almost 5%. Could you guess which trade was responsible for each outcome? The answer may surprise you. The $500 million notional block traded in-line, and a small order of $1.2 million notional block pushed the WisdomTree Brazilian Real Fund (BZF) price 5% away from its underlying value. The trades were done on different days and times, but the price of the ETF and its trading characteristics were similar. So what was the difference between the two trades?

On October 9, 2013, a 27-million-share block order worth approximately $500 million executed inside the bid/ask spread of BZF. You can see the trade in the highlighted area in figure 1.

Wisdom Image 1

The client who initiated that trade was able to work with an ETF liquidity provider who had the ability to access the underlying basket in the primary market on behalf of the client. It is important to remember that an ETF is at least as liquid as its underlying securities, regardless of the average daily volume. That demonstrates the beauty of the open-ended ETF structure and its ability to create new shares and redeem shares daily. This trade was successful from an execution standpoint because the client worked together with their trading partners on a best execution strategy.

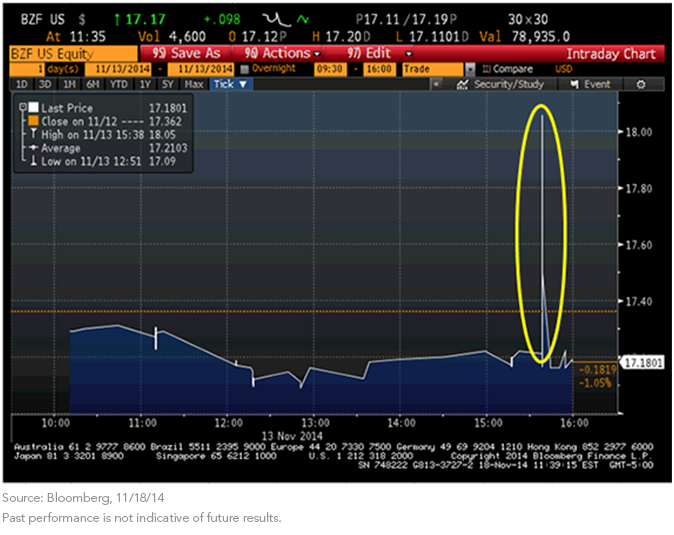
On the other side of the execution spectrum, another investor entered a 70,000-share ($1.2 million notional value) market order in BZF on November 13, 2014, just before 3:39 p.m. ET. This resulted in a quick spike up in the price of the ETF, as you can see in figure 2.

Wisdom Image 2

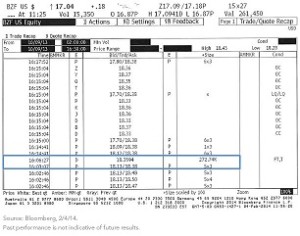
In this second example, the order book, or depth of the bids and offers of the ETF trading on the exchange, handled a market order of this size in an inefficient manner. The depth of bids and offers in an ETF order book is not always reflective of the liquidity of the underlying asset. While there is a lot of liquidity in Brazilian Real forwards, there are not a lot of resting orders in the BZF order book. By definition, a “market order” is designed to buy or sell an investment immediately at the best available price on the secondary market and will not stop until completed. For this reason, the order for 70,000 shares swept up all available shares for sale until it was completed, which resulted in the price increasing by almost 5%. This was followed by the price of the ETF correcting back in line with the “indicative value” of the underlying basket. Figure 3, and the yellow arrow, illustrate how quickly the order was filled and how far the price moved to satisfy the 70,000- share buy order in the order book.

You may be wondering, “Isn’t there a market maker who is supposed to be providing liquidity so this doesn’t happen?” The answer is yes. [MarketsMuse editor note: But unlike the days of yore, when stock exchange floor specialists were required to ‘take the other side’ of investor orders within the context of prevailing volume, the ‘new market structure’ does not mean that a market maker must provide any more than that he or she would be willing to buy or sell on either side of the prevailing quote. And, because the “beauty” of today’s electronic markets is that bid-offer spreads can move more quickly than you can blink your eye, a market order typically moves so fast that it may not provide enough time for the market maker to “reload” their bid or offer on the screen before the order has driven up the price significantly.]

In summary, these two examples are something that all ETF investors can learn from. On the Capital Markets Team at WisdomTree, we try to be proactive in consulting with our clients on best- execution strategies. For larger orders, always look to work with a liquidity provider who can access the underlying basket on the clients’ behalf and provide execution close to the “fair value” of the ETF. Lastly, we encourage all investors to be sure to have a full grasp of the depth of the order book before implementing any market order. We hope this information helps investors in future ETF.

For the full article at ETFtrends.com, please click here

neil azous-global-macro

Wisdom: Is $HEDJ The New Vogue Trade?

Below extract courtesy of a.m. edition of “Sight Beyond Sight”, the global macro trading commentary published by Stamford, CT-based macro strategy think tank Rareview Macro LLC.

“…For most of the second half of the year we have seen a surging dollar, and a falling euro.  Nothing seems to be coming that will disrupt that.

Now a lot of US investors have asked why the WisdomTree Europe Hedged Equity ETF (symbol: HEDJ) performance has been sub-optimal. Specifically, why isn’t this “strong dollar/weak euro” play not playing out much like last year’s Japan trade (strong dollar/ weak yen) as we saw with WisdomTree Japan Hedged Equity (DXJ)?

As a reminder, DXJ is a portfolio of Japanese stocks with a currency hedge overlay (i.e. 100% of assets is hedged). So HEDJ is the European version of DXJ. The underperformance therefore is simply stock-related.

For example, HEDJ is a basket of European stocks (i.e. 100% of assets is FX hedged). The underlying basket is a Wisdometree dividend weighted basket. It does not quite have the same weightings as the iShares MSCI EMU ETF (symbol: EZU) which is market cap weighted & large cap equivalent or the iShares Europe ETF (IEV) or any other standard index, but it does have a very high correlation.

If you compare HEDJ vs. EZU (i.e. use Bloomberg COMP function, HEDJ in line one and EZU in line 2 and then change the currency next to EZU to EUR instead of USD) you will see performance come back in line with HEDJ as it displays the effect of the FX hedge.

rareview macro nov 24

So HEDJ is working exactly the way it should given how it is constructed and using HEDJ to get long European stocks and a weaker EUR is correct instrument for that view.

So the question becomes, how do you gain using HEDJ? more

Wisdom Tree Gets Wise With New [Long] US Dollar ETF $USDU

indexuniverseCourtesy of Dennis Hudacheck, Index Universe

WisdomTree’s new long-dollar currency ETF is truly one for the ages, literally. I’ve long felt that we’ve needed an alternative to the decades-old US Dollar Index, which was created back in 1973.

So how does the WisdomTree Bloomberg US Dollar Bullish Fund (USDU) differ from its lone competitor, the $682 million PowerShares BD US Dollar Bullish Fund (UUP | B-39), which also happens to be the largest currency ETF?

For starters, there are major differences in the composition of the two funds. There are also differences in the structure of the ETFs.

More on that later, but first let’s start with the currency basket.

WisdomTree’s USDU closely follows the newly created Bloomberg Dollar Spot Index (BBDXY), which includes a trade- and liquidity-selected and -weighted basket of currencies that is rebalanced annually in December.

USDU currently shorts a basket of 10 currencies from major U.S. trading partners from developed as well as emerging markets, including the Brazilian real, Mexican peso, South Korean won and Chinese renminbi.

For the full article from IU, please click here.

WisdomTree Launches Japan Bond Bear Strategy, While Top Advisor Remains Bullish

From Zacks.com

WisdomTree has enjoyed an incredible level of success with its ultra-popular Japan Hedged Equity Fund ( DXJ ) this year. Thanks to the success that has come from focusing on Japan, the company now appears ready to put out another product targeting the Japanese markets (read: Time to Focus on Yen-Hedged Japan ETFs? ).

The issuer has filed for the Japan Bond Bear Strategy Fund, a strategy that would benefit investors if government bond yields rise (or in other words, bond prices slump). While a great deal of the key information – such as expense ratio or ticker symbol – was not available in the initial release , other important points were released in the filing.

Coincident to the WisdomTree Launch, MarketsMuse Editorial team noticed Cumberland Advisors’ Weekend Notes from Chief Economist Bill Witherell , who remains optimistic  on Japan, as evidenced by his Oct 6 piece ” Abenomics: Still Broadly On Track”
Read more about the launch here

WisdomTree: ETF Underlying Liquidity vs. Secondary Market Liquidity Explained (Again!)

etftrends logo imagesCourtesy of Zach Hascoe/WisdomTree Investments

We have heard it over and over: Exchange-traded funds (ETFs) are wrappers, and the true liquidity of an ETF is derived from its underlying constituents.1 While that statement is true, it does not completely explain different types of liquidity that can exist in an ETF.

Different types of ETFs can serve different purposes as exchange-traded vehicles, depending on the exposure they provide. Some ETFs are used primarily for hedging and intraday portfolio trading. These ETFs typically track major world benchmark indexes, and they trade millions of shares per day.  Other ETFs are structured more as investment vehicles and don’t typically have very high average daily trading volumes. Investors come into the products, hold their positions and eventually unwind the investment months or years down the road. While all ETFs can be held for prolonged periods or intraday, some ETFs experience more secondary market trading than others. At WisdomTree, we structure all our ETFs with liquidity screens to help provide sufficient implied liquidity (underlying liquidity), so even if the ETF has a low average daily volume in ETF terms, that does not mean the ETF is illiquid.

*MarketsMuse Editor note: Because ubiquitous trading screens often fall short in displaying actual liquidity v. what appears on the screen, institutional investors and RIAs are advised to defer to independent, “agency-only” execution firms –those who specialize in providing objective insight and the likely liquidity that exists “behind the scenes”

A recent comparison between the WisdomTree India Earnings ETF (EPI) and the WisdomTree LargeCap Dividend ETF (DLN) helps illustrate the difference between primary market and secondary market liquidity. As the industry’s first India ETF (launched in February 2008), EPI has become a popular way to gain intraday tactical exposure to India equities. For example, during the week of May 20, 2013, to May 24, 2013, EPI traded roughly $325 million of dollar trading volume on the secondary market. Yet during that week, EPI had no creation/redemption activity. There was $325 million of dollar volume traded and there were no inflows or outflows that week in EPI. That is secondary market liquidity. Investors were able to easily buy or sell EPI on the secondary market, as buy and sell orders were matched up by the broker-dealers. While new shares can be created on the primary market if demand warrants it, EPI is so widely traded by a wide variety of market participants, that often there is significant two-way trading in the ETF that happens on the exchange. At the end of the day, dealers left with inventory in EPI may decide to hold on to their positions because they are confident that two-way demand in the ETF will continue the next day. Continue reading

Institutional Investor: Vanguard’s Risky Switch in ETF Indexes

ii_logo_240px-wide  Courtesy of Rosalyn Retkwa

When it comes to the broad-based emerging-markets equity ETFs, Vanguard’s MSCI Emerging Markets ETF (VWO) is clearly the top dog. As of December 11, VWO had a market cap of $58.66 billion and an average daily volume of 17.74 million shares.

But back on October 2, Vanguard rocked the ETF world when it said it would drop MSCI of New York City as its index provider on 22 ETFs and substitute two other index providers, in the belief that by doing so, it could achieve “considerable savings for the funds’ shareholders over time.” That includes VWO, which will transition to a FTSE index at some unspecified point next year. Vanguard has been deliberately vague about any sort of schedule.

“We’re not saying exactly when the transitions will begin in order to prevent front-running,” says Joel Dickson, a senior investment strategist and principal in Vanguard’s Investment Strategy Group in Malvern, Pennsylvania. “The transitions will be staggered over several months,” he says, noting that VWO “will take longer than the other funds because it will be divesting all of its holdings in South Korea and investing the proceeds in some markets that are less liquid.”

And VWO’s exposure to South Korea is the problem. As of its latest statement on October 31, VWO had a 15.3 percent weighting in South Korea, including its No. 1 stock holding, Samsung Electronics. And that entire position will have to be eliminated when VWO moves from the MSCI index to the FTSE index.

Among index providers, there’s a vigorous debate as to whether South Korea should be classified as emerging or developed, and while MSCI still considers it to be emerging because of stock market and currency constraints, FTSE upgraded it to the developed-nation status in September of 2008, and implemented the change a year later, says Jonathan Horton, the New York City–based president of FTSE North America and head of its exchange-traded product unit. There’s also a budding price war among ETF sponsors.

Dong Lee CFA WallachBeth Capital
Dong Lee, CFA WallachBeth Capital

Still, the change in benchmarks is “a headache” for some institutional investors, says Dong Lee, the director of institutional sales at New York City’s WallachBeth Capital.  It often means they “have to present the investment case for the switch in indices in order to obtain board approval; and there’s a lot of work involved in that,” he says.

But will institutional investors switch to that other big dog of the category, BlackRock’s iShares MSCI Emerging Markets Index Fund (EEM), and in the process pay a much higher expense ratio of 67 basis points versus VWO’s 20 basis points to stick with MSCI? Continue reading