Tag Archives: spx

financial market prediction 2024 marketsmuse

2024 Financial Market Predictions

Knowing that nearly every reader has already consumed as many financial market predictions for the new year as they can stand, we decided to wait for the official first day of 2024 to publish our financial market predictions and outlook, if only because Santa Claus rallies that find Santa slipping from his sled during the last day of a year (one in which markets failed to close at an ATH), and followed by rinsing of markets the days into the first week of the new year (as is the case for 2024), can cause technical chart pundits to re-assess outlooks they made only a few weeks earlier. If the first day of 2024 is an indication (AAPL downgraded and down 3.5% and all major indices down .5% to 2%+) expect strategists to re-strategize! But that’s what pundits are best at doing: changing their views to address changes in price trends.

Here’s what we learned from 2023: Nearly all market prognosticators were wrong; at the outset of the year, and then they were caught “offsides” at least three or four times during the year; which is perhaps the only reliable statistic that we can confidently hang our hats on!

Let’s “go to the videotape”

At the close of 2022, after equities were pummeled (S&P 500 down 19.5%; Nasdaq Composite down 33%; Russell 2000 down 21.5% and DJIA down 8.9%), a December Bloomberg LP poll of 22 “top strategists”, had them proclaiming: “2023 will be, at best, a lackluster year”; with the mean prediction suggesting gains of 7% for the year.

At the time, those outlooks made sense. After all, the Fed was barely mid-way through a record-setting rate-hiking mode to battle inflation, and with [most] market participants of the view that we were moving towards an interest regime of 5% (which is actually within the historical 4%-6% range going back decades), equities and interest rate prognostics were certain that stocks would underperform historical average gains.

During the first month of 2023, SPX rallied 10%, inspiring the naysayers to turn bullish, raise their price targets, and get long on stocks at January month end. By the end of February, half of the gains achieved through January 30 were extinguished, and by the first week of March, SPX, the most-followed index, had reverted to exactly where the year had begun. That up-and-then-down price action led the crystal ball crowd to revisit and temper down their year-end outlooks.

As is typically the case, that exuberance encountered a dose of reality. Market participants chose to ignore the consistent signals sent by the Fed (i.e. “Do NOT expect a cut in interest rates, as our fight to bring inflation back to target levels is far from over!”). Instead, many called the ‘all clear’ signal—with an increasing number of strategists pointing to year-end 2023 SPX of 4500. Of course, equities swooned over the next three months into the end of October, albeit by a factor of a mere 9%; a classic ‘reversion to the mean’ that brought that major index back to 4115. That was approximately the level that had been the year-end 2023 forecast made by Pundits Inc in December 2022. And, by this time, most had dismissed any likelihood that equities, as benchmarked by SPX, could end the year higher than 4350. 

chart courtesy of Bloomberg LP all rights reserved

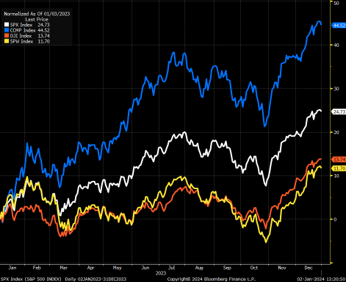
And, we all know what happened by the end of October. Thanks to a compilation of lower inflation and resilient economic data points that discounted the notion of a pending recession, and sweetened by a dovish voice from the Fed, every negative narrative turned upside down. SPX closed 2023 at 4775, up 24% on the year, NASDAQ ended the year with a gain of 34%, and to illustrate the broadening of the rally from the end of October to the end of December, the DJIA closed the year up 13%, the equal-weighted S&P 500 (see ticker RSP) gained 11%, and long-time laggard Russell 2000 index finished the year with a 15% gain.

Some predictors did get it right; select strategists from BMO, BofA, and the always bullish Tom Lee, who runs a firm called “Fundstrat” accurately guessed at the outset of 2023 that a variety of best-case scenarios would come to fruition.  These firms, as well as a majority of sell-side strategists, are determined that 2024 equity market returns will prove positive. The median projection calls for the S&P 500 to rise by 8% (5100), and the staunchest bulls, including market veteran Ed Yardeni of Yardeni Associates (who proved uniquely prescient for his 2023 outlook) believe the S&P 500 can reach 5400 by year-end 2024.  The most notable bears throughout the past three years i.e. Mike Wilson from Morgan Stanley and JP Morgan’s Marko “Kill Joy” Kolanovic remain pessimistic, yet less bearish than usual. Wilson is forecasting a slight drop for 2024 (year-end target of 4500) and Kolanovic believes that current (high) equities valuations, historically low volatility, and any of several prospective black swan events could find the SPX back at 4200.

FACTOIDS that lend [some] confidence to a positive 2024 equity market performance.

·According to LPL Research going back to 1950, 80% of the time in years following a gain of 20% or more have seen the S&P 500 rise an average of 10%.

·Since 1960, in periods where the SPX was down 10% or more, then up 10% or more the following year, there has been no instance where the SPX ended down in the third year. ·

chart courtesy of macrotrends.com

·Fortune 500 balance sheets remain relatively strong; debt levels remain manageable, and profit margins remain respectable, despite a long stretch of higher wages, higher cost of goods, and rising debt among consumers.

·The advent of Artificial Intelligence (AI and Generative AI) has permeated throughout the corporate world; leading to increased spending and investments that will [presumably] lead to higher productivity, greater efficiency, and hence, greater profit margins for companies in nearly every sector, even if the bottom-line returns may not begin to be noticed until the end of 2024 at the earliest).

Irrespective of Federal Reserve decisions to continue to pause, lower, or even raise interest rates in the coming year, the yield on the 10 year UST is NOT a long-term harbinger of equities prices; the average 10-year yield going back to 1970 is approximately 5.5%*

Concerns to Be Mindful Of

·Too Early Rate Cut by Fed (in their effort to mitigate risks of recession). ·Geopolitical Risk | Black Swan Event* (Russia/Ukraine; China/Taiwan; Middle East)

·Vast Majority of Equities Strategists are Bullish.

*Caveat: Black Swan events, including the assortment of pandemics, wars, and bank failures, and major changes in government leadership that have occurred during the last three years alone (and may occur in the coming year) rarely cause extended (i.e. long-lasting) losses in major equity indices. 

global macro stock conflagration

Global Macro Guru: Simmering Stock Conflagration?

MarketsMuse Global Macro curators, like many across the hedge fund complex, have attempted to decipher an investment thesis that can prove itself without being hijacked by short-term volatility. Deflation, Inflation, Oil, the Dollar and bets being made in advance of the Fed’s widely-expected interest rate adjustment are talking point ingredients that are potentially leading to a stock conflagration–according to global macro guru Rareview Macro LLC.

In the firm’s a.m edition of “Sight Beyond Sight”-the top bullet point “Top 10 SPX stocks on Alert” evokes a view that may not be rare, but the underlying premise is certainly worth contemplating….Thanks to Rareview’s top gun, Neil Azous, below is the opening extract..

Deflationary Impulse Spreading Beyond Inflation Levered Plays…Top 10 SPX Stocks on Alert

  • Getting from A to B
  • Canada and Crude Oil
  • South Africa and Metals & Mining
  • The Top 10 Stocks in the S&P 500

neil azous
Neil Azous, Rareview Macro

To get on the front foot today, we hope that you have an appreciation for how acute the pain is around the world on account of the latest downward price adjustment in crude oil.

There is no question that the latest 10% move lower (and counting) in the barrel has led to an “acceleration point” in various asset prices, corporate decision making, and countries.

The trade-weighted US dollar is making new highs (JPMQUSD) and the CRB Commodity Index (CRY) is making new lows today. Asset prices across Asia are once again feeling the reverberations rippling out from the latest weakness in the Chinese yuan (CNY) as fear builds of another devaluation. This is once again shining the spotlight on emerging market currencies, especially the Mexican peso (MXN) where the weakness today is a result of it being the main source for liquidity for emerging market proxies.

In equities, the alarm on the carbon monoxide detector for the Top 10 stocks in the S&P 500 is now at risk of going off more than at any other point since the October recovery. Some are noticing the two main symptoms of that – a headache and stomach nausea – but can’t seem to smell anything because they live in a world of isolation and only care about something else when they are forced to. And some of the longs we speak to who are more mindful of the top-down backdrop are almost as nervous as a long-tailed cat in a room full of rocking chairs.

Given the degree of concentration or narrow breadth, does crude oil weakness ultimately matter to these stocks? We may be close to finding out the answer to that.

Rareview Macro updates its views, along with trade ideas in real time via Twitter. To read the entire edition of the Dec 8 edition of Rareview Macro’s “Sight Beyond Sight, please click here

Global Macro ETF: A Rareview- Look No Further and Look Down Under $MVMVE

MarketsMuse global macro trading insight courtesy of extract from 4 Feb edition of Rareview Macro LLC’s “Sight Beyond Sight” with reference to $MVE and $MVMVE

Neil Azous, Rareview Macro

There are a lot of moving parts overnight, including the continuing debate on whether crude oil has bottomed or not. But if we had to focus on just one part of the narrative it would be Australia – the tentacles of which stretch out all the way to basic resources, yield, beta, deflation, and sentiment.

Now before dismissing any read through from this antipodean nation as not as relevant as other indicators, we would argue that what is happening there may well have more meaningful ramifications for global risk assets than most realize.

Firstly, the Market Vectors Australia Junior Energy & Mining Index (symbol: MVMVE) is showing the largest positive risk-adjusted return across regions and assets for the second day in a row.

By way of background, MVMVE covers the largest and most liquid Australian and offshore small-caps generating 50%+ of their revenues from energy & mining and listed in Australia. This basket of securities is not only highly geared to capex, utilities, infrastructure, and engineering but it is the poster child for Australia-Asia commodity speculation. Put another way, it has been the worst-of-the-worst and a favorite proxy to watch for those who hold the dogmatic view that China and Australia are both zeros.

We do not want to overemphasize the importance of just one index, so we are highlighting it more as a starting point than anything else. It is not uncommon for this index to show up on our equity monitor but it is rare for it to take the leadership across all regions and assets, and very rare for that to happen on back-to-back days. For that reason, it has prompted us to do some further analysis on that food chain.

Model Portfolio Update – Increased S&P 500 (SPY) Short Position Continue reading

Macro Trading View: Short Gold v. Long Silver; Long Euro Stoxx 50 (SX5E) versus Short S&P 500 (SPX)

Below excerpt from a.m. edition of Sight Beyond Sight, is courtesy of global macro think tank, Rareview Macro LLC

Neil Azous, Rareview Macro LLC

New Strategy – Short Gold vs. Long Silver

This morning we sold 3000 GLD 12/20/14 P112 at .63 to close.

We rotated our short Gold bias using put options into a short Gold versus long Silver spread using futures.

The updates were sent in real-time via Twitter.

Below are two illustrations: A “monthly” chart of long Gold versus Silver and a matrix containing our trade construction details.

Note that this is not a short-term “tactical” trade but rather an intermediate term “strategic” trade. As such, it will be managed with greater latitude in terms of risk.

Similar to the 200-day Moving Average (200-DMAVG), we find long-term Linear Regression Channels can be a strong technical indicator.

For those not familiar with Linear Regression Lines, it is a line that best fits all the data points of interest and consists of three parts: more

Professional Traders Lining Up to Sell SPX For the Wrong Reasons: Be Wary of the Good Idea Fairy: A Rareview View

Below commentary is courtesy of extract from a.m. edition of today’s Rareview Macro’s “Sight Beyond Sight”

A Simple View:  US Dollar, Gold, SPX, UST’s

Neil Azous, Rareview Macro LLC

The objectives we have laid out continue to materialize across the themes we are focused on.

The Q&A session with President Mario Draghi following today’s European Central Bank (ECB) meeting has concluded. We will leave it to the people with PHDs to debate the intricacies of what he had to say. But if price is the voting machine that always tells you the truth, then the weakness in the Euro exchange rate highlights that the press conference was simply dovish. Expect these same PHD’s to keep chasing as they lower their price targets again.

As evidenced in our most recent editions of Sight Beyond Sight, there was little doubt that Draghi would not strike a dovish tone. With his emphasis on a unanimous vote for further action if necessary and formally adding in the notion that the ECB’s balance sheet will return to 2012 levels (i.e. ~1 trillion higher), Draghi did a good job of walking back the negative tone that the media have tried to portray over the last 48-hours, especially the speculation about an internal battle/dissent/revolt building up against Draghi.

For us, it was never about whether the professionals sold the Euro after the event. They were going to do that anyway as the trading dynamics continue to point towards the Euro buckling under its own weight regardless of what Draghi says. Instead, we were more focused on a short covering event not materializing ahead of tomorrow’s US employment data and that has been largely removed for today.

So those bearish have to contend with the following factors: Continue reading

Crude Oil-The Russian Calculus; Deciphering The Macro-Strategy Tea Leaves

Below commentary is courtesy of Oct 8 a.m. notes from macro-strategy think tank Rareview Macro LLC’s “Sight Beyond Sight” and is provided as a courtesy to MarketsMuse readers who embrace smart insight.  For those with interest in or exposure to the assortment of globally-focused ETFs across asset classes, we think you’ll welcome this content…If subscribing to newsletters from leading experts is not your ‘bag’ (regardless of how fairly-priced Rareview’s is), you should want to follow Rareview Macro’s twitter feed

Growth Scare Expanding Now…Large Cap Equity Indices Most at Risk
• Russia Enters the Vice-Grip
• EU Growth Profile: Cross-Asset Correlation to Reconnect & Lead EURO STOXX 50 Index Lower
• US Growth Profile: Pillars of Housing, Autos & Texas to Lead S&P 500 Index Lower
• China: H and A Share Markets Continue to Diverge…A Share Market is Correct
• Model Portfolio Update: Taking Profit or Restructuring Brazil (EWZ) Equity Position

Overnight

Right now everyone has a favorite metric that points to further disinflation. But, at the end of the day, the real world only really cares about one – Crude Oil.

Brent Crude Oil has made another new low and WTI Crude Oil has taken out the January low.

We are highlighting this first today for a number of reasons. Continue reading

The Anger Indicator: A Rareview

Below extract courtesy of this a.m.’s edition of Rareview Macro’s Sight Beyond Sight..(Re-published with permission from Neil Azous)

Neil Azous, Rareview Macro LLC

Here is an aggregation of the various statistics either sent to us from subscribers or we came across during our readings this weekend.

1.  Japan Government Pension Fund (GPIG):  Apple (AAPL), Exxon and Microsoft have the heaviest weighting in the MSCI Kokusai Index; ~87% of GPIF’s foreign stock holdings follow this benchmark. (Source:  Eurofaultlines)

2.  As far as we can tell the degree of these inflows have not yet been widely observed by other paid forecasters on the Street. EM Portfolio Inflows Reach New High In May: Our EM portfolio flows tracker indicates that portfolio inflows to emerging economies continued their upward trend of the last several months, reaching the highest level since September 2012, when the Fed launched QE3 (Chart 1). In May, EMs are estimated to have received $45 billion in portfolio inflows from global investors, up from $28 billion in April and $27 billion in March. The May figure reflects $28 billion going into EM bond markets (portfolio debt flows,Chart 2) and $17 billion into EM stock markets (portfolio equity flows, Chart 3). (Source: Institute of International Finance) Report

3.  This week the S&P 500 will surpass the 1995-96 record for number of consecutive days in which the index has traded above its 200-day moving average.

4.  SPY closed above its upper Bollinger 5 days in a row through Friday. SPY has only closed above its upper Bollinger 4 days in a row 4 times since 2009. (Source: Fat Pitch)

5.  Relative Strength Indicators (RSI)

a.  The S&P 500 (SPY) 9-day RSI is over 70 = Overbought

b.  The NASDAQ (NDX) 9-day RSI is 74 and AAPL’s is 80 = Overbought

c.  The Transports (IYT) 9-day RSI is over 77 = Overbought

d.  The Semiconductors SOX) 9-day RSI is over 70 = Overbought

6.  Since 1950, the DJIA has lost -1.9% and SPX -2.1% in June. The last 20 years have been even weaker. Moreover, the SPX has been down in 11 of the last 16 mid-term elections Junes (Source: Stock Traders Almanac).

7.  The VIX has closed below 12 for five straight days, the longest streak at that level since 2007 (Source:  Volatility Trader) Continue reading

Stock ‘fear gauge’ flawed, Equity Trading Chief says


Excerpts courtesy of Simon Jessup, Reuters  

MarketsMuse Editor Note: Yes, the headline and the article are both elementary observations for many; yet there remain many others (including investment managers) who misunderstand the meaning of VIXreuters


Investors seeking to predict the magnitude of share price moves at times of market flux may get a faulty steer from a closely watched “fear gauge”, one of investment banking’s top equity traders has warned.

Citi’s Mike Pringle, global head of equity trading at the third-biggest U.S. bank, told Reuters that the VIX volatility index , is now as much a traded asset as it is a guide to investors seeking protection from losses.

The VIX reflects Standard & Poor’s 500 .SPX options prices and, therefore, expectations of future market moves. The idea is that as people become fearful of losing their money, they are more willing to buy a put option as protection.

At the moment, it remains at very low levels.

“A big mistake the market makes is looking at the VIX as an indicator of stock market risk. Why? Because it’s an asset class and it’s more traded for yield than protection,” Pringle said. “It’s still relevant in extremes, but not in a normal functioning market,” Pringle said.

While persuading others of the VIX’s flaws is not easy, Pringle said Citi’s handling of risk management in equities had been restructured accordingly.

Rather than relying solely on the VIX, Citi traders and clients can turn to their “Central Risk Desk”– through which a large proportion of its trades are routed.

The computer programs that underpin the desk’s activities assess around 60 measures of market stress and timing – from global risk arbitrage spreads to dividends to repo rates – to get a better read on sentiment, behavior and deal timing.

Looked through this prism, there is greater risk currently in global markets than the narrower VIX is suggesting.

For the entire article from Reuters, please click here

UK’s Abydos Hedge Fund Using Options to Prepare for Iran Strike

(Reuters) – Abydos Capital, a new hedge fund run by a former partner at one of London’s most high-profile oil investors, is worried about a potential military strike against Iran and plans to use options to protect his portfolio.

Jean-Louis Le Mee, Chief Investment Officer of Abydos, told Reuters he thinks there is a 25 to 50 percent chance of an Israeli strike against Iran’s nuclear capabilities, an act that would likely send stock markets tumbling and drive up oil prices, hitting hedge funds that hadn’t protected their portfolios.

Le Mee, one of the first hedge fund managers to discuss such a strategy, said he was planning to use options to profit from a spike in oil prices and a fall in equities via the S&P 500 index .SPX if Iran was attacked over its nuclear programme.

“There’s a high chance that something will happen either this summer in June/July or after the U.S. elections,” said Le Mee, whose former firm BlueGold made headlines in 2008 by calling the peak of the market. “If talks break down, then the Israelis could do something very quickly.

A typical hedging policy could see a fund buy call options, the right to buy at a certain price, on an asset it expects to rise, and buy put options, the right to sell at a predetermined price, on assets it expects to fall. Continue reading