Tag Archives: dave nadig

bond etf liquidity

Calling for Clarity: Corporate Bond ETF Liquidity

There continues to be a call for clarity with regard to the topic of corporate bond ETF liquidity and where/how corporate bond ETFs add or detract within the context of investors ability to get ‘best execution’ when secondary market trade in underlying corporate bonds is increasingly ‘illiquid.’

This not only a big agenda item for the SEC to wrap their arms around, it is a challenge for “market experts” to frame in a manner that resonates with even the most knowledgeable bond market players.

MarketsMuse curators noticed that ETF market guru Dave Nadig penned a piece for ETF.com last night “How Illiquid are Bond ETFs, Really?” that helps to distill the discussion elements in a manner that even regulators can understand.. Without  further ado, below is the opening extract..

“Transcendent liquidity” is a somewhat silly-sounding phrase coined by the equally silly Matt Hougan, CEO of ETF.com, to discuss the odd situation in fixed-income ETFs—specifically, fixed-income ETFs tracking narrow corners of the market like high-yield bonds.

But it’s increasingly the focus of regulators and skeptical investors like Carl Icahn. Simply put: Flagship funds like the iShares iBoxx High Yield Corporate Bond ETF (HYG | B-68) trade like water, while their underlying holdings don’t. Is this a real problem, or a unicorn?

Defining Liquidity

The problem with even analyzing this question starts with definitions. When most people talk about ETF liquidity, they’re actually conflating two different things: tradability and fairness.

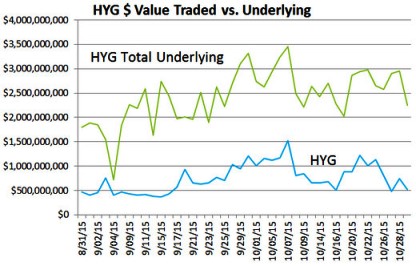
Tradability is actually a pretty simple concept: How well will the market let me get in or out of an ETF? And for narrow fixed-income ETFs (I’m limiting myself to corporates, in this analysis), most investors should be paying attention to the fairly obvious metrics, e.g., things like median daily dollar volume and time-weighted average spreads. By these metrics, a fund like HYG looks like the easiest thing to trade ever:

On a value basis, the average spread for HYG on a bad day of the past year is under 2 basis points. It’s consistently a penny wide on a handle around $80, with nearly $1 billion changing hands on most days. That puts it among the most liquid securities in the world. And that easy liquidity is precisely what has the SEC—and some investors—concerned.

Fairness

But that’s tradability, not fairness. Fairness is a unique concept to ETF trading. We don’t talk about whether the execution you got in Apple was “fair.” You might get a poor execution, or you might sell on a dip, but there’s no question that your properly settled trade in Apple is “fair.”

In an ETF, however, there is an inherent “fair” price—the net asset value of the ETF at the time you trade it—intraday NAV or iNAV. If the ETF only holds Apple and Microsoft, that fair price is easy to calculate, and is in fact disseminated every 15 seconds by the exchange.

But when the underlying securities are illiquid for some reason (hard to value, time-zone disconnects or just obscure), assessing the “fair” price becomes difficult, if not impossible.

If the securities in the ETF are all listed in Tokyo, then your execution at noon in New York will necessarily not be exactly the NAV of the ETF, because none of those holdings is currently trading.

Premiums & Discounts

In the case of something like corporate bonds, the issue isn’t one of time zone, it’s one of market structure. Corporate bonds are an over-the-counter, dealer-based market. That means the iNAV of a fund like HYG is based not on the last trade for each bond it holds (which could literally be days old), but on a pricing services estimate of how much each bond is worth. That leads to the appearance of premiums or discounts that swing to +/- 1%.

To read the full article, please click here

nomura suspends leveraged ETF new creations

Nomura Says Sayonara to New Leveraged ETF Creations

Sayonara City As Japan Getting Crash Course in Leveraged Returns With Nikkei ETF

MarketsMuse ETF update courtesy of Bloomberg LP Oct 15–Nomura Asset Management Co. said it would suspend on Friday the creation of new shares in a large leveraged exchange-traded fund, as well as two others, citing liquidity concerns.

The move applies to the Next Funds Nikkei 225 Leveraged Index Exchange Traded Fund (BBRG Ticker: 1570 JP Equity <GO>), which has about ¥734 billion ($6.2 billion) in assets. The fund’s shares are up about 8.7% this month. Nomura said shares will continue to trade.

“The temporary suspension has been determined, considering the current situations of fund management including the liquidity of the underlying Nikkei 225 futures and the total assets under management of three ETFs,” Nomura posted on its website. The firm will continue to receive redemptions, it said.

A Nomura representative wasn’t available to comment.

The decision highlights an increasingly warned-about side effect of exchange-traded products’ growing popularity: a mismatch between the liquidity of some funds and their holdings.

The Nomura decision also highlights concerns about leveraged products, which provide investors with outsize exposure to certain asset classes, employing tactics such as borrowed money and derivatives. The $6.2 billion fund provides investors with two times the exposure to the Nikkei 225.

The products have been popular in the U.S., but the size of Nomura’s Next Funds Nikkei 225 Leveraged Index ETF is larger than any such leveraged exchange-traded product in the U.S., said Dave Nadig, director of ETFs at financial-data provider FactSet. There are close to 1,800 exchange-traded products listed in the U.S., and about 230 of them are leveraged, he said.

Regarding how leveraged funds operate, Mr. Nadig said: “The math makes people’s heads hurt.”

It’s not the first time an exchange-traded product has run into obstacles because of its own popularity. Credit Suisse Group AG had to suspend the creation of new stock in the VelocityShares Daily 2x VIX Short-Term ETN in February 2012, after demand for the security hit a limit set when the product was created in 2010. Barclays Plc also halted issuance in its iPath Dow Jones-UBS Natural Gas Total Return Sub-Index ETN in August 2009.

For the full story from Bloomberg LP, please click here

SEC Flip-Flops on Non-Transparent ETFs; What’s Next? “NextShares!” ; Eaton Vance 18, BlackRock: 0

Neale Donald Walsch - Believing is SeeingA MarketsMuse Special column….

Within less than 2 weeks after the all-visionary SEC blocked NYSE Arca from listing non-transparent, actively managed ETFs developed by ETF Industry icon BlackRock Inc., as well as those designed by upstart Issuer Precidian Investments (see MM edition Oct 23), this past Thursday, the same almighty securities regulator over-ruled itself and approved a different set of similarly non-transparent and actively-managed ETFs concocted by Eaton Vance, a competing ETF powerhouse and multi-billion asset manager within the $2tril + exchanged-traded fund marketplace.

Why was BlackRock “boxed out from under the board”, yet Eaton Vance victorious in the eyes of the SEC, the agency that is presumably mandated to protect retail investors from fund managers who prefer not to disclose their so-called ‘secret strategy sauce’? Its a head-scratcher for sure, particularly when the SEC’s turn-down ruling against BlackRock included the following statement: Continue reading

Do Bond ETFs Pose A Systematic Risk? Regulators Confused, Investors Confounded

Index fund managers are finding it challenging to ensure the bonds they need in the prices they want, driving them to make trade-offs that leave supervisors vulnerable in a market downturn and may hurt investors.

Bond liquidity has all but dried up for corporate problems after new regulations and capital requirements compelled Wall Street banks to slash their stocks of fixed income products following the fiscal disaster. That’s especially challenging for index fund supervisors who must get certain bonds to be able to monitor specific standards.

The lack of liquidity additionally means funds could have trouble selling bonds in the event interest rates rise and also the investors who have sunk about $1.2-trillion (U.S.) in net deposits into long-term bond funds since the end of 2004 head for the exits. The Financial Stability Board (FSB) is analyzing whether exchange-traded funds pose a hazard to the global financial system for exactly that reason, in accordance with the Bank of Canada’s representative to the committee. Continue reading

Market Structure: The Great “Flash Boys” Debate and Putting the Genie Back in The Bottle

tumblr_m66pvmdFe61rog4ypo1_500  MarketsMuse Editor Note:  Though we typically focus on using a high-touch approach to aggregating the more topical  and poignant ETF, Options and Macro-Strategy news items, the  nearly never-ceasing diatribes re market structure and the impact of “high-frequency trading” which has either been incited or simply elevated by Michael Lewis’s book “Flash Boys” inspires us to distill the multitude of most recent opinion articles and punditry promoted by the ever-increasing universe of “content experts.”

In that spirit, we point our readers to 2 different pieces worth picking over:

1. For the ETF-focused audience, this week’s published comments from ETF.com’s Dave Nadig, “Great Flash Boys Idea IEX Doesn’t Matter” is a solid read for RIAs and the universe of investment managers who use exchange-traded funds. As always, Dave frames his observations and insight in a thoughtful, non-conflicted and erudite manner. Here’s the link to the ETF.com posting.

2. For institutional equity fund managers, institutional equity brokers and whomever else might be intrigued by the latest “survey of capital market professionals” conducted by ConvergEX, one of the major institutional order execution platforms. Their study finds that 70% of those canvassed believe the market structure is “unfair” to them. The study was published this week and since re-published by an assortment of industry media websites, including TABB Forums, and starts with the following: Continue reading

The Follies of ETF “Flows”: Understanding the Trading Data

indexuniverseCourtesy of Dave Nadig

In yesterday’s flows article, I talked about one of the biggest problems with ETF flows data; that is, a lot of times, that data is buggy.

The second problem is thornier. Even if you believe the data, it’s important to understand how it can be misleading.

The Second Problem: Misinterpretation

Even assuming that the flows data was perfect, I frequently see flows stories with headlines like “Investors put $100 million into GLD yesterday,” which give me pause. The reality of why money flows into and out of an ETF is slightly more complex than that.

If you’re an investor—whether you’re a hedge fund or my mother—you get ETFs the same way. You buy them on the open market. Only APs actually “put money” into an ETF. And they only do it when it makes financial sense for them to do so. So while ETFs can go in and out of favor—and experience enormous swings in volume—they’ll only actually grow or shrink in size when the ETF becomes over- or underpriced.

Let’s look at a simple example. Below illustrates the data on the Market Vectors Indonesia ETF, IDX. It’s an annoying fund for a market maker, because to make new shares, they have to go buy a bunch of Indonesian stocks, and that market’s not open during U.S. trading hours. Consequently, they’ll let the fund trade to a bit of a premium or discount before they’ll step in. Continue reading

ETF Volatility: The Real Story Behind The [Bloomberg] Story

indexuniverseCourtesy of Dave Nadig’s July 12 column

This morning Bloomberg published a story titled “ETF Simplicity Betrayed by Volatility in Market Selloff.”

In the article, the authors contend that they’ve run the numbers, and that ETFs are just flat-out more volatile than mutual funds. Here’s the lead:

“Share prices for the 10 largest diversified emerging-market ETFs on average were 42.6 percent more volatile than their underlying indexes from May 22 to June 24.”

Let’s break down what they could possibly mean here, and let’s start with a few baselines.

While the article claims it’s not addressing the issue of premiums and discounts—that is, how far off fair value a given ETF closes in market trading versus its underlying index—it’s fairly clear that’s not the case. If it were, then the following chart wouldn’t make sense.

This is a rolling look at the 20-day historical volatility of the iShares MSCI Emerging Markets ETF (NYSEArca: EEM) and the actual index it tracks, over the period in question. I’m looking here at the actual NAV, and as you’d expect, they track extremely closely:

1---EEM-VOL

The bottom line looks at the difference, and you might ask: “Well, why is there any difference at all?”

Continue reading

Actively-Managed ETFs Poised to Proliferate in 2013 (?)

Courtesy of WSJ Dec 28 Weekend Edition and reporter Joe Light

The world of ETFs is about to get pumped up.

A long-heralded blossoming of actively managed exchange-traded funds is one step closer, now that the Securities and Exchange Cwsjlogoommission earlier this month removed a hurdle that discouraged money managers from releasing such products.

For small investors, the change could mean more choices. But it also could cause money managers to add more risk to their portfolios as previously forbidden investment strategies become available, analysts say.

In March 2010, the SEC stopped approving new actively managed ETFs that use derivatives, which are contracts that derive their value from that of underlying securities, such as options and credit-default swaps. Portfolio managers use derivatives frequently in actively managed mutual funds to protect against the threat of bond defaults, currency fluctuations and other risks. The ban discouraged fund companies from starting actively managed ETFs. Instead, the vast majority of ETFs are low-fee index funds, which passively track an established benchmark.

Earlier this month, Norm Champ, director of the SEC division of investment management, said in a speech that the agency now will approve the use of derivatives in ETFs under certain conditions.

Continue reading

Debunking The Myth re: ETF Spreads

A daily double courtesy of IU’s Dave Nadig

ETFs can be more efficient than the stocks they track, even in surprising places.

At almost every conference and ETFs 101 webinar we do, you’ll hear us saying again and again that spreads matter.

In fact, getting investors to understand the importance of spreads, depth of book, and limit orders make up the bulk of the live trading sessions we do.

After all, next to expense ratios, the spreads and commissions you pay on your ETF trades are one of the only things knowable in advance and, depending on your time horizon, they can have a real impact on your performance.

One of the maxims we always put out there, almost as an oddity, is that ETFs can often be more efficient than the stocks they’re composed of. We usually pull a chart of an extreme case to prove the point: an enormously liquid ETF, like the iShares Emerging Markets ETF (NYSEArca: EEM) and its comparatively wide-spread and thinly traded stocks—thinly traded by New York Stock Exchange standards, anyway.

When it came time to update the chart, however, I took a different approach.

Instead of hunting for illiquid underlying stocks and super-liquid ETFs, I went for the opposite. I cast around for an example of an ETF with thin volume, where the portfolio was small enough so that most investors could, if they wanted, just buy all the stocks themselves. Surely in such a case, the spreads of the liquid stocks would beat the spreads of the illiquid ETF, right?

Software was the perfect place to look, and IGV was our poster child. IGV is the iShares S&P North American Technology-Software Index Fund (NYSEArca: IGV). It holds 54 stocks, including some of the most liquid companies in the world, like Microsoft and Oracle. IGV, however, is a wee bit less liquid, trading less than 50,000 shares on an average day.

To see the full article, click here!

Light On Knight: Editorial Opinion

Editorial Opinion

In an era in which “CYA” is perhaps the most-used acronym by institutional fund managers focused on fiduciary responsibilities, its almost surprising to notice the many anecdotal remarks that point to a single-point-of reliance on Knight Capital’s role within the ETF marketplace.  Some would think it “shocking” that so many institutions were caught without having a chair when Knight stopped the music and instructed their customers to trade elsewhere.

Yes, based on volume/market share, Knight had become the single-largest “market-maker” for ETFs, as well as a broad universe of exchange-listed equities. Arguably, their pole position is courtesy of pay-to-play pacts with large equity stake holders and ‘strategic partners’ who control significant retail and institutional order flow; including household names such as TD Ameritrade, E-Trade and Blackrock.

This is not to suggest that Knight Capital has not earned its designation for being a formidable market-maker within the securities industry. Their most senior executives are deservedly well-regarded by peers, competitors and clients alike, and their trading capabilities are revered by many.

And yes, Knight’s most recent travails are, to a great extent the result of a  “bizarre software glitch” that corrupted the integrity of their order execution platform. There’s a reason why software is called soft-ware.

That said, this latest Wall Street fiasco–which resulted in a temporary disruption of NYSE trading and the permanent re-structuring of one of the biggest players on Wall Street who was rescued from the brink of total failure– is less about that firm being “too big to fail”,  or the many spirited debates regarding “algorithms that have run amok”, or even the loudly-voiced and often under-informed shouts coming from politicians in Washington regarding the ‘pock-marked’ regulatory framework by which US securities markets operate.

This story is about something much more basic: dependence by seemingly savvy fiduciaries  on a single, market-making firm that figuratively and literally trade against customers in order to administer the daily execution of literally hundreds of millions of dollars worth of retail and institutional customer orders. This happens, all despite the same fiduciaries  commonly inserting the phrase “best execution” within their very own mandates, internal policy documents and regulatory filings.

Many of these fiduciaries may not truly appreciate where Knight resides in the trading market ecosystem, the actual meaning of  “best execution”, or how they can achieve true best execution without being reliant on a single firm whose first priority is not to the client, but to themselves and their shareholders, who depend on the firm’s  ability to extract trading profits when ‘facilitating’ customer orders as being the ultimate metric for the value of their employee bonus and/or their ownership of shares in that enterprise.

CNBC, Barrons, and IndexUniverse (among others) have been following this story closely, and we point to excerpts from a reader comment posted in response to IU’s Aug 6 column  “4 ETF Lessons From Knight”  by Dave Nadig: Continue reading