Below commentary is courtesy of Oct 8 a.m. notes from macro-strategy think tank Rareview Macro LLC’s “Sight Beyond Sight” and is provided as a courtesy to MarketsMuse readers who embrace smart insight. For those with interest in or exposure to the assortment of globally-focused ETFs across asset classes, we think you’ll welcome this content…If subscribing to newsletters from leading experts is not your ‘bag’ (regardless of how fairly-priced Rareview’s is), you should want to follow Rareview Macro’s twitter feed
Growth Scare Expanding Now…Large Cap Equity Indices Most at Risk
• Russia Enters the Vice-Grip
• EU Growth Profile: Cross-Asset Correlation to Reconnect & Lead EURO STOXX 50 Index Lower
• US Growth Profile: Pillars of Housing, Autos & Texas to Lead S&P 500 Index Lower
• China: H and A Share Markets Continue to Diverge…A Share Market is Correct
• Model Portfolio Update: Taking Profit or Restructuring Brazil (EWZ) Equity Position
Overnight
Right now everyone has a favorite metric that points to further disinflation. But, at the end of the day, the real world only really cares about one – Crude Oil.
Brent Crude Oil has made another new low and WTI Crude Oil has taken out the January low.
We are highlighting this first today for a number of reasons.
Firstly, the Dollar-Ruble (USD/RUB) is now down over 10% since February 28th, the day before Russia’s incursion into the Crimea began. Russia has now intervened in their currency markets to defend the Ruble for the third time in October alone – and it is still only the 8th.
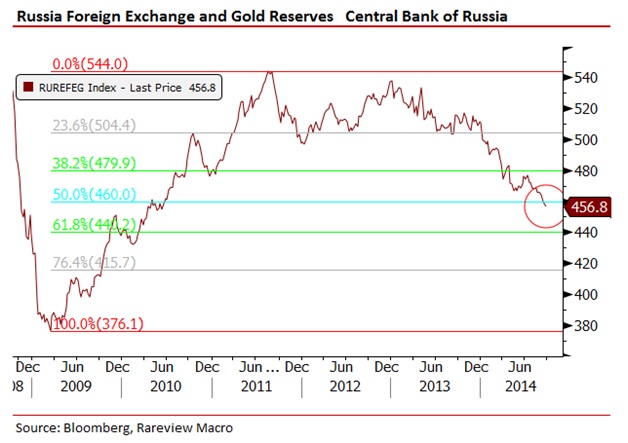
Secondly, see the below illustration. While Russia has significant capacity left to defend itself, its Foreign Exchange and Gold Reserves have crossed the 50% retracement level ($460 bln) following the Global Financial Crisis. The market knows that at the current pace needed to defend the currency, in less than one year it will surpass the GFC low ($380 bln). The next release of its reserve data is due tomorrow. Our guess is that it will be watched a lot more closely than usual. Oh how we would welcome even a sniff of Gold sales at some point.
Thirdly, the rate at which paid forecasters estimate Russia is burning through those reserves may now have to altered, and potentially in a significant way. Why? Because the majority modeled their numbers from February 28th to June 30th and the average price of Brent crude oil during that period was ~$107. The key point here is that the models have yet to adjust for the ~15% drop in the “barrel” since then.
What does this mean?
It means that the chances of Russia avoiding a very large sell-off in the Ruble are now diminishing as they are only one step away from entering the crude oil “vice-grip”. To what speed and degree is difficult to handicap but the exercise for Russia as a result of lower crude prices has become that much more painful.
Perhaps it is time to reshuffle the letters to C.R.I.B. from B.R.I.C.? After all, Russia is being sent back to its “infancy” in terms of valuation and foreign direct inflows (FDI).
 Right now if you speak to anyone in Europe, they will tell you that the bigger problem is that growth will slow down at a faster pace in the US than in their continent going forward.
Conversely, if you speak to someone in the US, they will tell you that the bigger problem is that growth will decelerate at a faster pace in Europe than it will in the US going forward.
Personally, we do not care which investor base is correct. What we care about is finding the assets that will have the most acute positive and negative reaction if this view on lower growth on both sides of the Atlantic Ocean turns out to be correct.
Right now it is important not to get caught in the weeds. There are dozens of charts with fancy symbols measuring obscure metrics. “Keep it simple, dummy.”
Simplistically speaking, this negative growth profile in Europe is already being reflected in the Euro exchange rate, high beta credit, late cycle equity sectors, and sovereign interest rates. The key point being here is that the EUR has weakened, CCC credit has widened, the “IME” in the “TIME” trade – Technology, Industrials, Materials, Energy – have been crushed, and German Bund yields are at their tightest spread.
Given the durability of all of these relationships historically there is only one place left where it is not being discounted – equity indices.
It is just a matter of time before the equity indices reconnect to all the other major assets (i.e. correct) and that is why we are short the EURO STOXX 50 Index (symbol: SX5E).
In the US, the story is even simpler.
There are three economic pillars – Housing, Autos and Texas.
When two pillars are standing investors are willing to look through the issues surrounding the third one. Right now, investors believe all three either look like Stonehenge or have already fallen over.
Housing has been sick or else under-performing the wider recovery in past cycles for quite a while so we will not spend any time on this.
In the US, Autos peaked in August. The axe-wielders in bank research departments have already downgraded the names and space. As a reminder, Autos in the US are the ONLY sub-sector to underperform in all five period when inflation (CPI) rose by 1% year-over-year going back to the 1990’s. Ironically, they are currently one of the worst performing sub-sectors, although not as a result of inflation this time.
While the issues around Housing and Autos are well flagged the discussion on Texas is brand new.
Now to be clear this is not an assault on the “United State of Texas” as we have many friends and readers there. Instead this is us introducing a new discussion point in the overall narrative around Crude Oil.
On the margin lower WTI Crude Oil prices will have an impact on shale production and investment. The break-even prices may vary but there is little questioning that some of the explorers has to be nervous about current projects being able to work with Crude below $90.00
For those who do not follow Texas closely the data is pretty dramatic. To put it in context, Texas has created the most amounts of jobs by any state since the GFC by a very wide margin. Their unemployment rate is a point lower and the GDP rate is a point higher than the national averages. They are close to 10% of all US GDP and growing. Texas has four of the 10 ten housing markets in the US – Dallas, Houston, Austin and San Antonio.
The risk is now growing that a further fall in oil prices may lead to a slower growth rate in Texas.
For those who really want to throw bombs we would also note that this is a canary in the coal mine for high yield bonds if this path were to materialize. With forward cash flow (FCF) being negative in the fracking business it would be a lot harder to fund or refinance via a debt offering. It does not matter anyway because no one would be doing a lot of incremental drilling if Oil was at $80.00 as the IRR would be low and you would just cut the drilling budget.
We will leave you with this quote in the context of what Texas means to our country:
“What always happened is you’d get too much oil and gas and the price gets too cheap and you quit drilling — can’t make money,” T. Boone Pickens, founder and chairman of BP Capital LLC in Dallas, said in a Sept. 15 phone interview. “You break the price down and you’ll stop the boom right quick.”
So the question becomes what stops Crude Oil?
A stealth tightening by the Saudi’s?
Russia making new noise on the world stage now that they are entering the “vice-grip”?
A change in sentiment that comes out of this well-attended energy conference that begins tomorrow?
A noted technician calling for a bottom in Crude based on his model being able to detect a price reversal?
The FOMC committee leaving the “considerable time” language in this month’s statement to show the world they are not making a policy mistake by tightening too soon?
A 30-40% retracement in the recent US Dollar strength?
We are not sure but do believe out of all metrics Crude Oil is the most important barometer for growth or lever for global intervention at this point.
Now before anyone goes and gets excited about believing there is a floor in crude oil because the Saudi’s or some other relevant body may tighten supplies behind closed doors we would argue that if growth conditions continue to deteriorate in both Europe and the US at the same time, including Texas, there will not be enough supply taken out of the global market to offset the degree of negative sentiment. That means oil can re-price even lower on a larger growth scare.
So what is the asset that has yet to reprice growth or a potential downgrade in earnings due to disinflation concerns? Like Europe, the answer is large cap equity indices – S&P 500 and NASDAQ.
See the below chart. The S&P 500 has now factually broken the uptrend from 2011. Very few are playing this from the short-side for a move down to the 200-DMAVG. The reason being is that the majority are nervous about the true “pain trade” – lower S&P 500 and US Dollar at the same time.
Sidebar: This is another example why Europe is a better hedge than buying S&P 500 puts given that European equities would have to correct by 7% to catch up with the historical correlations to the other asset classes.
